Economic Projections for Asylum Seekers and New Immigrants: U.S. and State-Level Data
Immigration is hardly a new social trend in the United States. Of the 330 million people living in the United States, 46 million are immigrants, 16 percent of the total population.
Over the past two years, however, a new trend in immigration has generated a different kind of attention. The number of people seeking asylum and other protection in the United States has risen sharply.
How can we expect these new immigrants to fare in the economy? To model this question, Immigration Research Initiative looked at how immigrants with similar characteristics currently make ends meet in the United States, and in each of the 50 states plus the District of Columbia individually.
Wages Earned and Taxes Paid by Newly Arriving Immigrants
New immigrants arriving in the United States can expect to earn a median wage of about $22,000 per year. If there are two wage earners in a family their combined income would be about $44,000.
Wages Earned And Taxes Paid
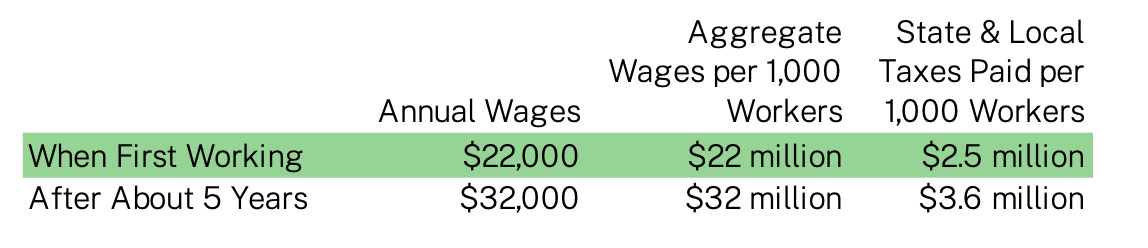
Fig 1. Immigration Research Initiative modeling, using data from 2021 American Community Survey 5-year data. See methodology section for details.
That means newly arriving immigrants will have a hard time making ends meet, to be sure, but are likely to be slightly above the federal poverty level even when they first get here. The federal poverty level in 2021 was $12,880 for individuals and $26,500 for a family of four.
Once immigrants have been here for about five years, their median wage will likely increase to about $32,000 per year, as they earn higher wages and as a larger share get full-time jobs, raising a two-earner family’s income to about $64,000.
Newly arriving immigrants also grow the economy and pay taxes. In the first year after arrival, the IRI model predicts that for each 1,000 newly arrived immigrant workers the aggregate annual wages paid is $22 million—a direct economic benefit to the region in which they are working in both the value of work produced and in added local spending power. Costs for immigrant integration are largely at the state and local level, so it is notable that state and local tax revenues also increase as immigrants settle in the area. For each 1,000 workers, initial state and local tax revenues are predicted to increase by $2.5 million. After these immigrants have been here for about five years, the IRI model predicts that for each 1,000 workers annual wages to be $32 million and state and local tax revenues would be $3.6 million.
Also of note, for work authorization there is typically a delay of at least six months and often even longer before people get authorization even among those who are eligible through, for example, temporary protected status or by seeking asylum. Having access to legal services is critical in this process. And, some newly arriving immigrants also do not get work authorization. The projections here are based on a substantial number of people getting work authorization. Not all—about a quarter to half of the comparison group on which calculations are based—don’t have work authorization. But clearly work authorization makes a big difference and we should do everything we can to expedite it.
Immigrants Move Up in the Economy Over Time
The long history of immigration in the United States shows that once immigrants get a footing in the economy, they learn English, get better jobs, and earn higher wages. There is every reason to think that, given the opportunity, people currently seeking safety in this country would do the same. By the time immigrants have been here about five years, they can expect to earn about $32,000, up from a $22,000 median wage for those who have been in the U.S. less than two years. A key reason for this is that many immigrants start working part-time jobs when they first get to the U.S., and then get full-time jobs once they have settled. After being here for 20 years it is $40,000. In many cases, families have two working adults, which makes their family income double the individual wage.
Projection of Wage Advancement For Newly Arriving Immigrants

Fig. 2. Immigration Research Initiative analysis of 2021 ACS 5-year data. Projected wages are in 2021 dollars.
Projected wages are in 2021 dollars, so the future wages can be understood in today’s economic terms. This also assumes some pathway to work authorization, for those who do not gain work authorization the upward path is limited.
For reference, 200 percent of the federal poverty level is about $26,000 for individuals, and $53,000 for a family of four. This measure, double the poverty level, is often used as a proxy for what families need to cover basic household expenses.
When immigrants first arrive in the United States, the IRI model shows some of the positions immigrants are most likely to find are as construction laborers, cashiers, housekeepers, and cooks. Many will also find work in occupations with at least slightly higher wages in jobs such as retail salespeople, truck drivers, registered nurses, or nursing assistants.
By the time immigrants have been here for longer and learn English better, the job mix has changed. After being here five to ten years, the IRI model predicts that in addition to the above jobs, a significant number of immigrants are likely to move into jobs as nursing assistants, personal care aides, managers, chefs or head chefs, and accountants.
Methodology
To model the likely outcomes for new arrivals, IRI looked at immigrants in the United States who had been in the country for less than two years, and who don’t speak English very well. The group of people in the data includes both documented and undocumented immigrants. The sample of people who have been in the U.S. less than two years basically represents non-citizens (since with rare exceptions people can’t apply for citizenship until later).
To model the outcome for those who have been here for about five years, we expanded the analysis to include those who speak English “very well,” but did not include those who speak “only English” at home, reflecting the fact that many—though not all—immigrants learn to speak the language very well within five years. We did not include in the analysis people who speak “only English at home. To get a robust sample size, IRI looked at two years for new arrivals and five to ten years for those who have been here longer.
The tax analysis is based a simple use of the Institute on Taxation and Economic Policy’s report “Who Pays: A Distributional Analysis of the Tax Systems in All 50 States.” According to the most recent, 7th Edition, the overall average for state and local taxes as a share of income is between 10 and 12 percent for everyone in the first four income quintiles. Families in the bottom quintile pay 11.3 percent on average, with differences state by state. For the national estimate we use the overall average, in the state-by-state data, we use the ITEP-reported rate effective tax rate for the lowest quintile in each state.
Many, but not all, of the workers would have work authorization. Many newly arriving immigrants are eligible to apply for Temporary Protected Status, humanitarian parole, asylum, or other designations that give them temporary or permanent work permits. The Institute on Taxation and Economic Policy’s related report, “Undocumented Immigrants’ State and Local Tax Contributions,” shows that immigrants without work authorization pay an effective tax rate of 8 percent, a little lower than those with work authorization. The overall tax estimate might be increased some by families with incomes on the higher range, and decreased some by the proportion of immigrants who are undocumented.
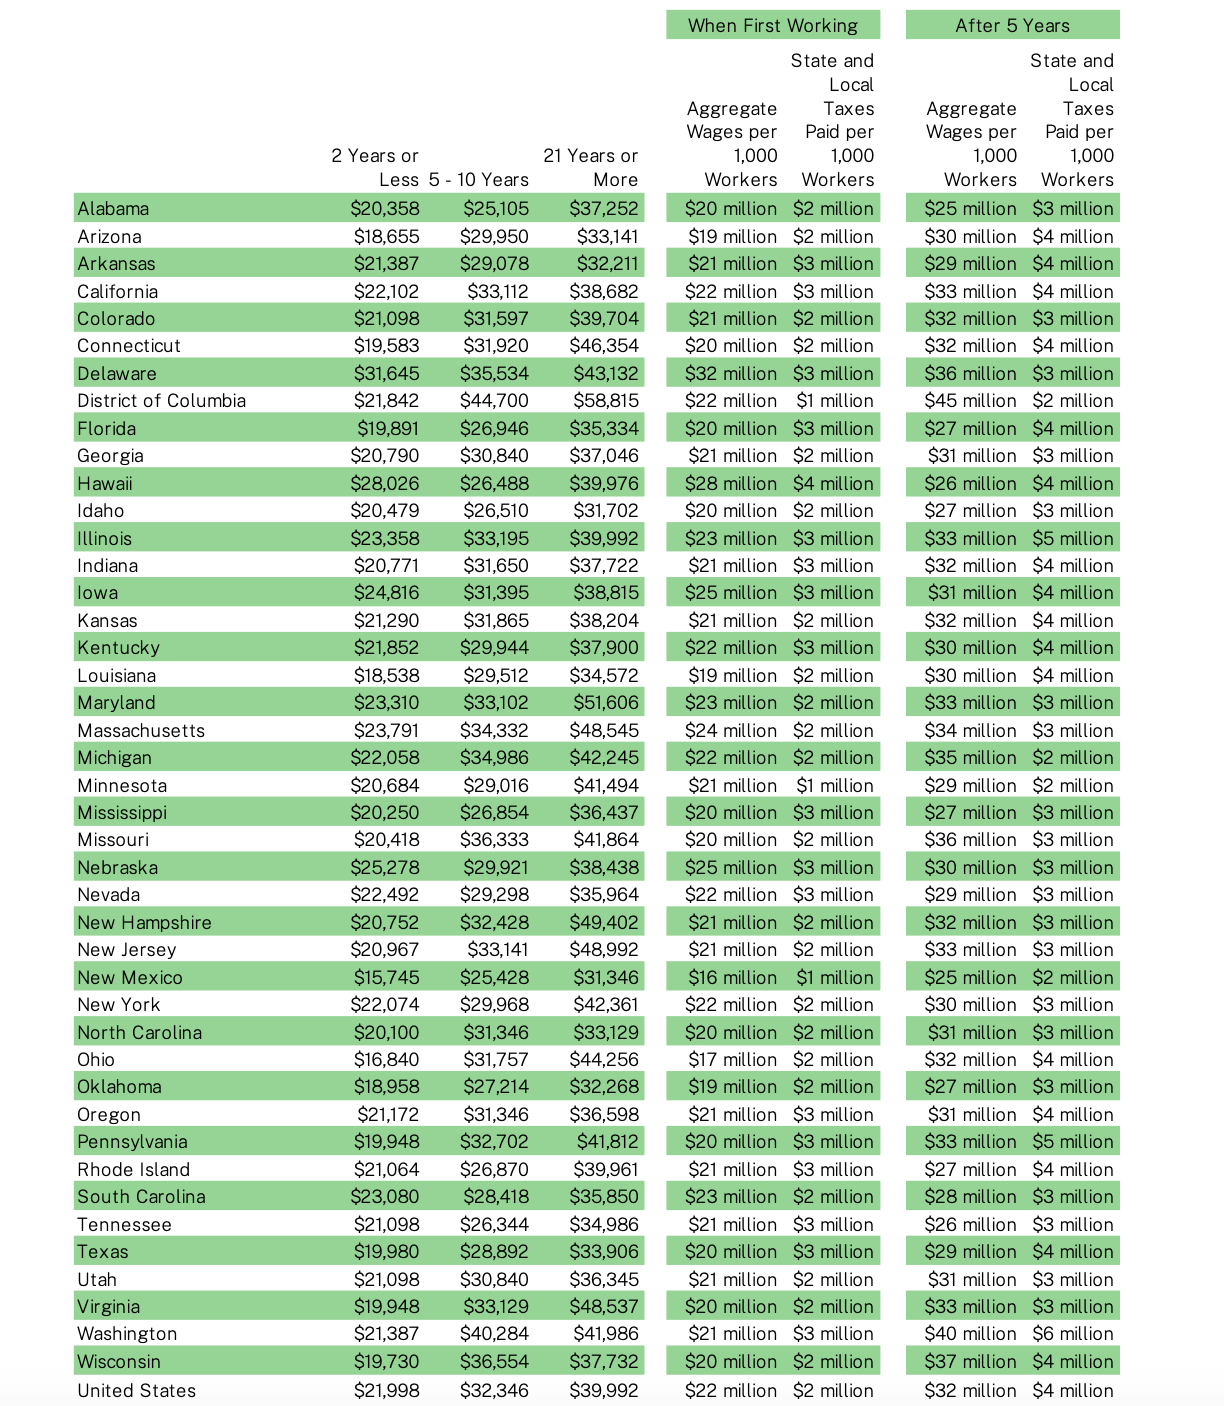
Wages Earned and Taxes Paid: Data for 50 states and Washington, D.C.