Immigrants in the New York City Economy: Overcoming Hurdles, Yet Still Facing Barriers
There are 3.2 million immigrants living in New York City and 5.8 million in the New York metro area, according to an analysis of the 2021 American Community Survey 5-year data. Making up 36 percent of the city’s population and 30 percent of the metro area population, immigrants are a vital part of the social, economic, and cultural life of the city and region.1All data in this report are Immigration Research Initiative analysis based on the 2021 American Community Survey 5-year data. Immigrants here are defined as people born in another country and living in the United States, whatever their immigration status. “Immigrants” includes refugees, asylees, people with green cards, naturalized citizens, people with temporary visas, and immigrants who are undocumented.
The economic role of immigrants has frequently been misunderstood. On the one hand, immigrants are a big and important part of the economy. And, on the other hand, immigrants are disproportionately concentrated in low-wage jobs. Both things are true at the same time.
- Immigrants are responsible for $625 billion of the New York metro area’s $2 trillion GDP. 2We measure economic output as the immigrant share of total earnings, on the assumption that people are paid in proportion to their economic contribution. In the case of immigrants, and indeed for most workers, this is a conservative estimate since workers are often paid less than a fair share of economic output. Bureau or Economic Analysis shows New York metro areas GDP to be $2 trillion in 2021. Gross Domestic Product is the broadest measure of economic output–it is a measure of all goods and services produced in an area. Because the New York economy has many commuters, the best place to gauge local GDP is at the level of the metropolitan area. In the New York metro area, immigrants make up 30 percent of the population, and are responsible for 31 percent of GDP.
- In New York City, leaving out the suburbs, immigrants account for 36 percent of the population, and 37 percent of total wage, salary, and business income New York City residents. Earned income is a frequently used proxy for economic output, and in this case measures the share of economic output among New York City residents.
- A key reason for this high share of economic output is that immigrants are concentrated in working age. In New York City, while immigrants make up 36 percent of the population, they make up 42 percent of the working-age population (ages 16 to 64), and a corresponding 44 percent of the labor force. In the New York metro area, immigrants make up 30 percent of the population, 34 percent of working age population, and 35 percent of the labor force.
- Immigrants work in jobs across the economic spectrum. A common misperception is that when we are talking about immigrants we are talking mostly about people in low-wage work. Yet, looking at all immigrant workers—documented and undocumented—62 percent of those with full-time jobs earn at least $40,000 per year, which is a middle wage for full-time work.
- While most immigrants are in middle- or upper-wage jobs, immigrants are at the same time disproportionately likely to be in low-wage jobs. In all, 38 percent of immigrants are in jobs paying under $40,000, compared to 22 percent of U.S.-born workers.
- Race and gender are as much a factor as nativity in wage outcomes for workers. Men have higher wages than women. And people who are white have considerably higher wages than Black or Latinx workers, whether they are U.S.-born or immigrants. Asians and Pacific Islanders who are born in the U.S. do nearly as well as U.S.-born white workers, while AAPI New Yorkers who are immigrants face the same labor market conditions as Black and Latinx workers.
1. Immigrants Work in Jobs Across the Economic Spectrum
For this report, low wage was defined as earning less than two-thirds the overall median—in New York City, that means under $40,000 per year. Middle wage was earning between two thirds of the median and double the median, $40,000 to $120,000. And upper wage was earning more than double the median, over $120,000.3These wage brackets are based on full-time (at least 35 hours/week), year-round (at least 50 weeks/year) wage and salary earnings, or farm or business income. The threshold for middle-earners is extrapolated from the common practice of defining middle class as between two-thirds and twice the median household or family income. See, for instance, the middle-class calculator of the Pew Research Center. To get a better picture of individual workers, IRI looks at a worker’s earnings rather than household or family income.
The IRI analysis shows that 62 percent of immigrants in New York City earn at least a middle wage—50 percent in middle wage range and an additional 12 percent in the upper-wage bracket of $120,000 or more. Among U.S.-born workers, 78 percent earn at least a middle wage. Among U.S.-born workers, a smaller share are in low-wage jobs than among immigrants, and a larger share are in middle-wage jobs.
Most workers in the New York City economy are in jobs that pay over the low-wage level of $40,000 per year. By definition, there will always be some workers in bottom rungs of the economy, but it is not necessary for there to be some workers below a certain percentage of the median. Around the world, two thirds of the median is often considered the poverty wage level, and in some countries very few full-time workers fall below that level.
In New York City, 22 percent of U.S.-born workers and 38 percent of immigrant workers make under two thirds of the median wage. The immigrants who make up a disproportionate share of this group face numerous barriers in the labor market, from language to educational attainment, recognition of credentials, immigration status or discrimination in the workplace.
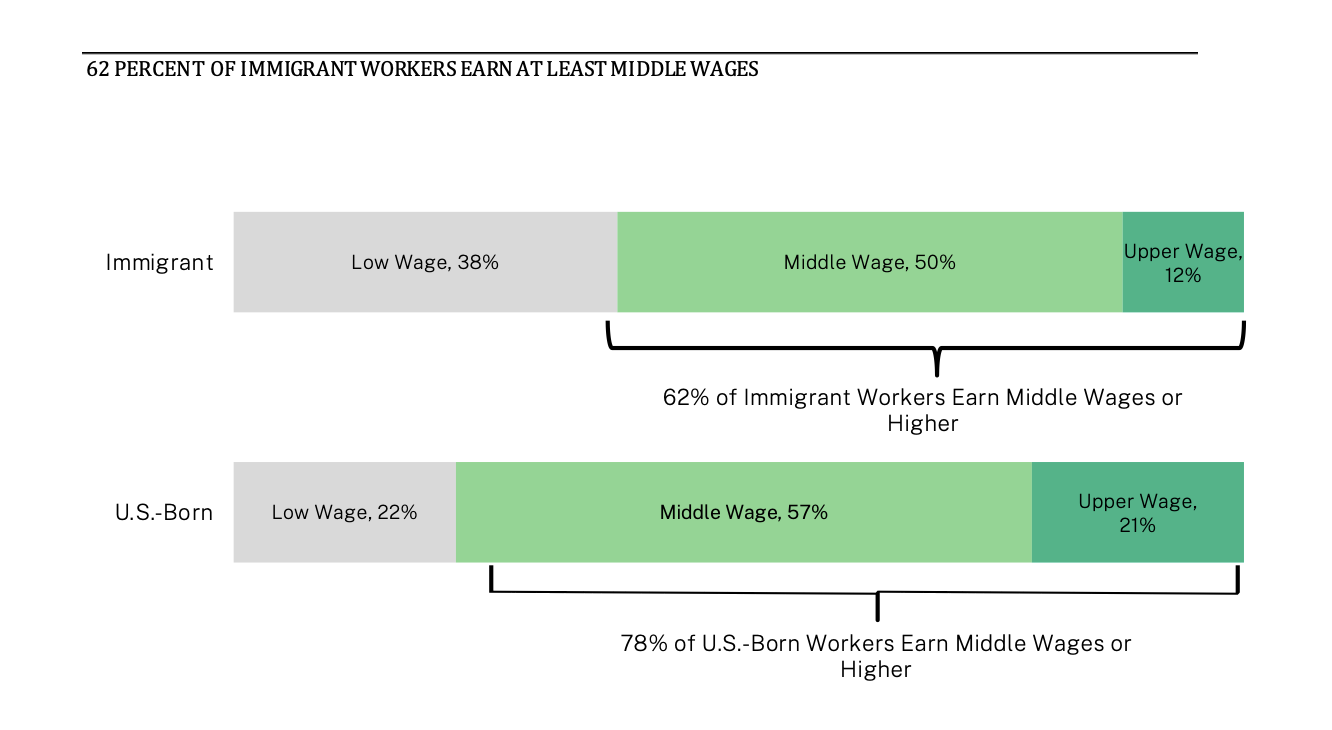
Fig 1. Immigration Research Initiative analysis of 2021 American Community Survey 5-year data, looking at annual earnings for full-time, year-round workers. “Low wage” is people earning under 2/3 of the median—that is, under $40,000; “middle wage” is from 2/3 to double the median, $40,000 to $120,000, and “upper wage” is earning above $120,000.
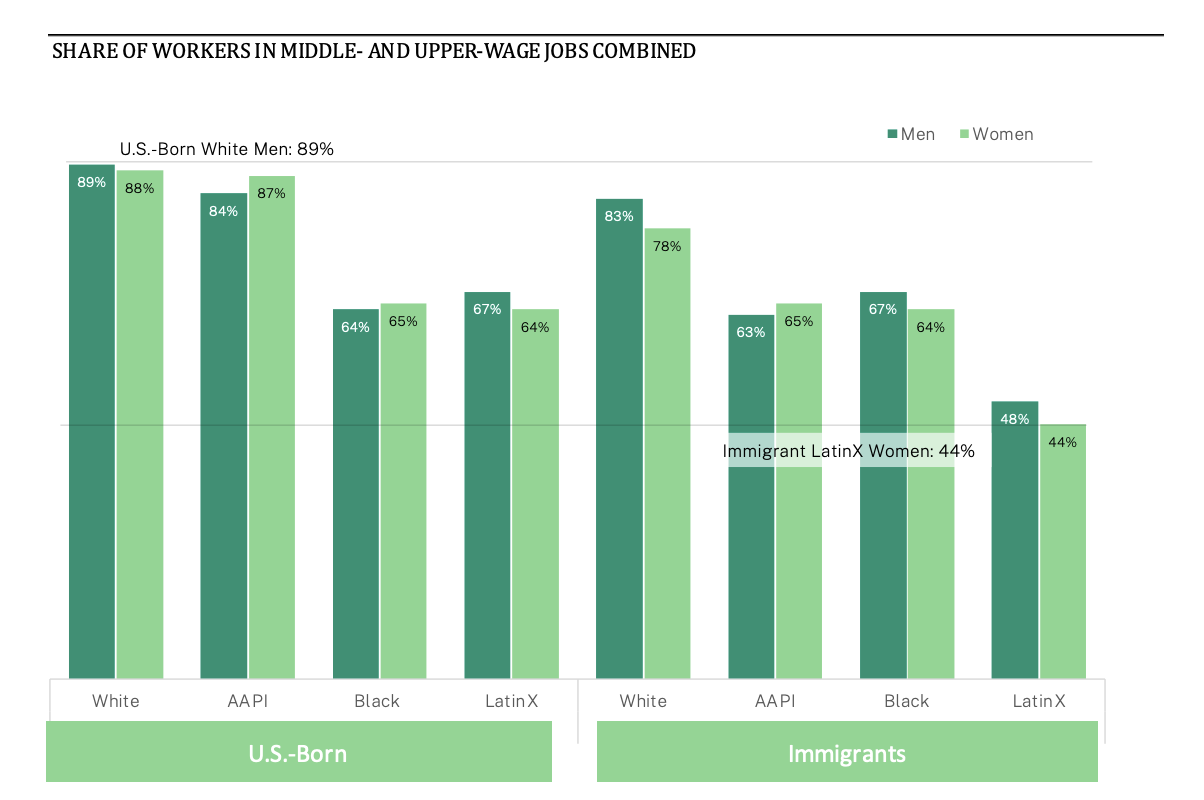
Fig 2. Immigration Research Initiative analysis of 2021 American Community Survey 5-year data. Latinx is all Hispanic/Latino of any race; other races are non-Hispanic, White, Black, and AAPI.
2. Race and Gender Are a Big Factor in Economic Outcomes
Immigrants and U.S.-born residents work in jobs across the economic spectrum, and so do people in all race and gender groups. However, workers are not spread evenly.
Figure 2 shows that race and gender4While IRI recognizes that gender is not binary and that not all Americans are either men or women, the American Community Survey and U.S. Census Bureau only account for two genders. In this analysis, white refers to non-Hispanic white, Black to non-Hispanic Black, Asian to non-Hispanic Asian American and Pacific Islanders—sometimes shortened to AAPI or to “Asian,” and Hispanic or Latinx refers to people of any race who respond to the Census Bureau that they of Hispanic, Latino, or Spanish origin. are significant factors in determining economic outcomes. U.S.-born white and Asian/Pacific Islanders, both men and women, are the most likely to earn middle and upper wages. Black and Hispanic/Latinx workers in general, and AAPI immigrants, are substantially less likely to earn a decent wage for their work.
Hispanic/Latinx immigrants are the groups that face the greatest hardship. Just 48 percent of Latinx men and 44 percent of Latinx women born outside the United States make more than the low-wage threshold of $40,000. This fact highlights the challenges of Latinx immigrants, a group of Americans who are often the target of hateful anti-immigrant rhetoric, actions of the U.S. deportation regime, and workplace abuses, as well as barriers they may face due to level of formal education or English language ability.
The Divisions Are Starkest in Upper-Wage Occupations
Figure 2, above, looks at all workers who earn at least $40,000—combining the middle- and upper-wage categories. Figure 3, below, zooms in to look just at those workers in the upper-wage range, people who earn at least $120,000 per year.
The economic disparities in the share of people earning upper wages are even starker. White men stand out most significantly. Thirty-seven percent of white U.S.-born men earn over $120,000, as do 32 percent of white foreign-born men. Black and Latinx workers are starkly less likely to be among upper-wage earners: just 4 to 9 percent of Black or Latinx workers regardless of nativity or gender. AAPI workers are between the two.
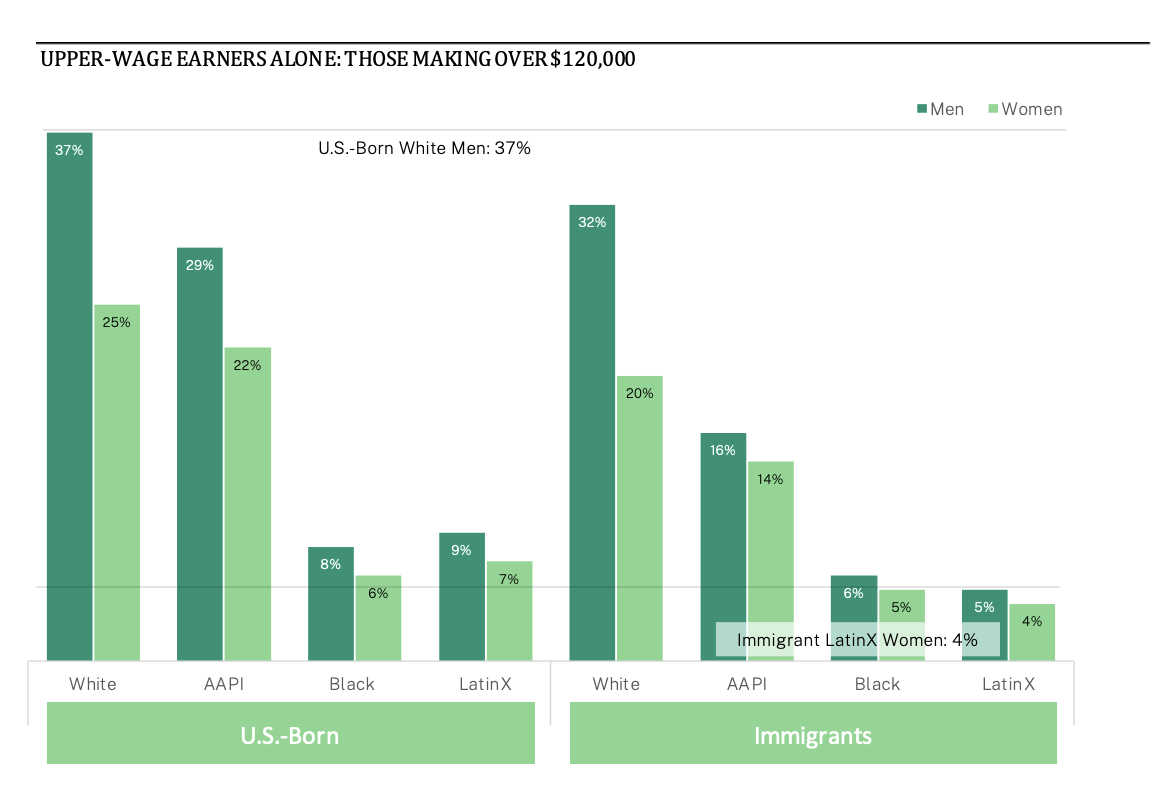
Fig 3. Immigration Research Initiative analysis of 2021 American Community Survey 5-year data. Full-time workers earning over $120,000, that is: more than double the New York City median for full-time workers.
There is also a substantial gender wage gap among upper-wage earners. Women in every group are less likely to be upper-wage earners than men, with the biggest differences among white workers. U.S.-born white women are 12 percentage points less likely to be upper-wage earners than white men, and foreign-born white women are a similar 12 percentage points less likely to be upper-wage earners than foreign-born white men. Both U.S.-born and immigrant white women, however, still are far more likely to be upper-wage earners than Black or Latinx men or women.
Black and Latinx Workers Trapped in Low-Wages Jobs
Working full time and earning under $40,000 per year leaves many workers in every demographic group struggling to make ends meet. There are, however, clear race, gender, and immigration components that contribute to who is mostly likely to be in these low-wage jobs in the United States.
U.S.-born white men (11 percent) are the least likely to be trapped in low-wage work. In general, U.S.-born white men and women, and U.S.-born AAPI men and women are comparatively less likely to be in low-wage jobs than all other workers.
About a third of all U.S.-born Black and Latinx workers, and about the same share of foreign-born Black workers, are in low-wage jobs. The highest share of workers in low-wage jobs are Latinx immigrants: 52 percent of men, and 56 percent of women.
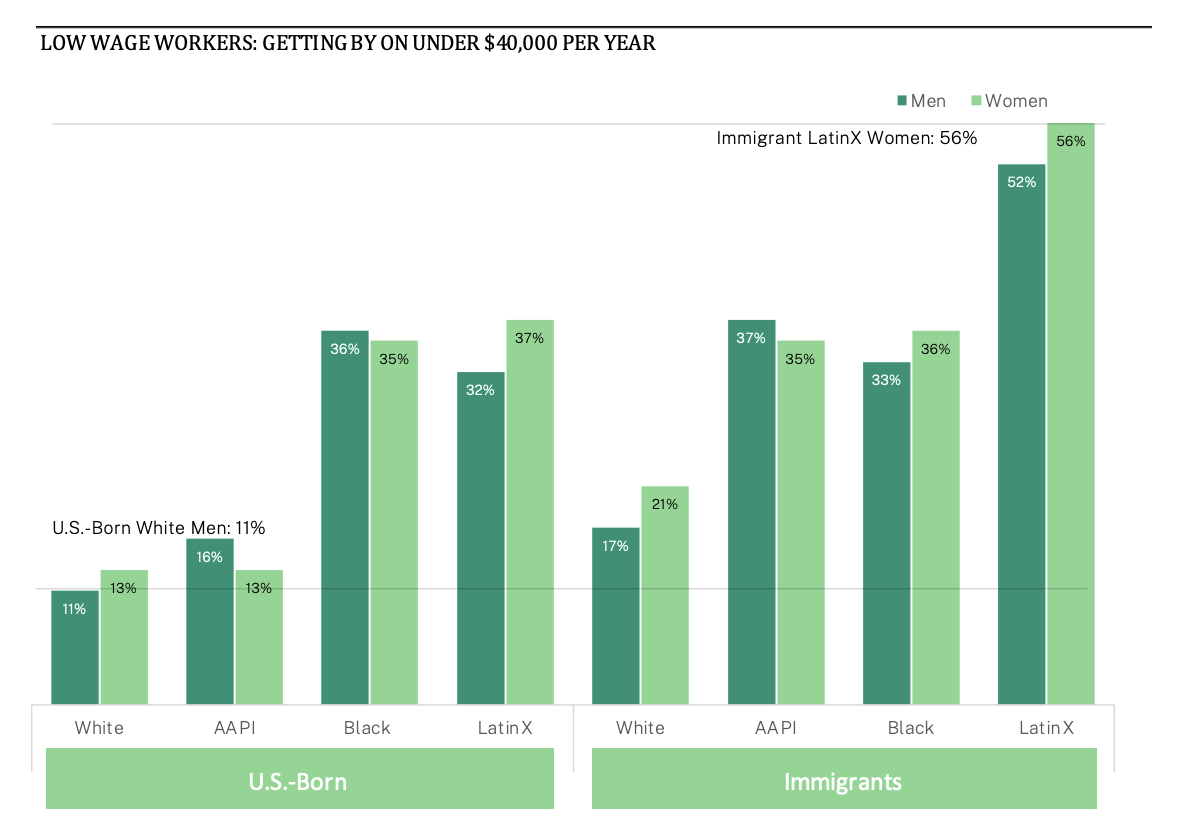
Fig 4. Immigration Research Initiative analysis of 2021 American Community Survey 5-year data. Full-time workers earning under $40,000, that is: less than 2/3 the median for full-time workers in New York City.
Overall, most workers in the U.S. are in jobs where they make middle wages- and upper-wages, but there are stark differences among diverse groups. Race, gender, and nativity all stand out as significant factors impacting individuals’ economic outcomes in the United States. U.S.-born Black and Latinx workers, as well as foreign-born Latinx workers, are significantly less likely to earn middle- and upper-wages than other workers. Women are also much less likely than men to make a decent wage—in many cases strikingly so. These findings highlight what many Americans, especially women and Black and Indigenous People of Color, already know to be true from their own experiences. What is important to note is that the impacts systemic racism, class inequality, misogyny, and nativism are clearly quantifiable and create very real disparities regarding individuals’ ability to succeed in the economy.
- 1All data in this report are Immigration Research Initiative analysis based on the 2021 American Community Survey 5-year data. Immigrants here are defined as people born in another country and living in the United States, whatever their immigration status. “Immigrants” includes refugees, asylees, people with green cards, naturalized citizens, people with temporary visas, and immigrants who are undocumented.
- 2We measure economic output as the immigrant share of total earnings, on the assumption that people are paid in proportion to their economic contribution. In the case of immigrants, and indeed for most workers, this is a conservative estimate since workers are often paid less than a fair share of economic output. Bureau or Economic Analysis shows New York metro areas GDP to be $2 trillion in 2021.
- 3These wage brackets are based on full-time (at least 35 hours/week), year-round (at least 50 weeks/year) wage and salary earnings, or farm or business income. The threshold for middle-earners is extrapolated from the common practice of defining middle class as between two-thirds and twice the median household or family income. See, for instance, the middle-class calculator of the Pew Research Center. To get a better picture of individual workers, IRI looks at a worker’s earnings rather than household or family income.
- 4While IRI recognizes that gender is not binary and that not all Americans are either men or women, the American Community Survey and U.S. Census Bureau only account for two genders. In this analysis, white refers to non-Hispanic white, Black to non-Hispanic Black, Asian to non-Hispanic Asian American and Pacific Islanders—sometimes shortened to AAPI or to “Asian,” and Hispanic or Latinx refers to people of any race who respond to the Census Bureau that they of Hispanic, Latino, or Spanish origin.