There are 45 million immigrants living in the United States. Making up 14 percent of the national population, immigrants are a vital part of the social, economic, and cultural life of all American communities.1All data in this report are Immigration Research Initiative analysis based on the 2021 American Community Survey 5-year data. Immigrants here are defined as people born in another country and living in the United States, whatever their immigration status. “Immigrants” includes refugees, asylees, people with green cards, naturalized citizens, people with temporary visas, and immigrants who are undocumented.
The economic role of immigrants has frequently been misunderstood. On the one hand, immigrants are a big and important part of the economy. And, on the other hand, immigrants are disproportionately concentrated in low-wage jobs. Both things are true at the same time.
- Immigrants account for 17 percent of the U.S. economic output (GDP), even higher than their share of the population. The United States has a $19.6 trillion economy according to the Bureau of Economic Analysis 2021 statistics, which means immigrants are conservatively responsible for $3.3 trillion of economic output.2We measure economic output as the immigrant share of total earnings, on the assumption that people are paid in proportion to their economic contribution. In the case of immigrants, and indeed for most workers, this is a conservative estimate since workers are often paid less than a fair share of economic output.
- A key reason for this high share of economic output is that immigrants are concentrated in working age. In the U.S., while immigrants make up 14 percent of the population, they make up 17 percent of the working-age population (ages 16 to 64), and a corresponding 17 percent of the labor force.
- Immigrants work in jobs across the economic spectrum. A common misperception is that when we are talking about immigrants we are talking mostly about people in low-wage work. Yet, looking at all immigrant workers—documented and undocumented—65 percent of those with full-time jobs earn at least $35,000 per year, which is a middle wage for full-time work.
- While most immigrants are in middle- or upper-wage jobs, immigrants are at the same time disproportionately likely to be in low-wage jobs. In all, 35 percent of immigrants are in jobs paying under $35,000, compared to 26 percent of U.S.-born workers.
- Race and gender are as much a factor as nativity in wage outcomes for workers. Men have higher wages than women. And people who are white have considerably higher wages than Black or Latinx workers, whether they are U.S.-born or immigrants.
- In low-wage occupations, more than half (58 percent) work in service or production jobs, such as building cleaners, cooks, meat processors, or sewing machine operators. The pandemic highlighted the importance of many of these jobs to America’s daily life that can often seem underappreciated or invisible. There is little doubt that the 7.3 million3 Estimate from the Center for Migration Studies. undocumented immigrants estimated to be in the labor force are overwhelmingly in these low-wage occupations.
- Among middle-wage occupations, occupations, immigrants are spread across every sector of the economy. Significant numbers of immigrants work nurses, computer programmers, educators, architects, logistics specialists, emergency services staff, and much more.
- Among upper wage occupations, immigrants are highly concentrated in a few fields. Fully 76 percent of immigrants in upper-wage occupations work either in computer occupations, or in management and finance occupations. Most are either software developers or CEOs.
1. Immigrants Work in Jobs Across the Economic Spectrum
For this report, low-wage was defined as earning less than two-thirds the overall median—nationally, that means under $35,000. Middle wage was earning between two thirds of the median and double the median, $35,000 to $104,000. And upper wage was earning more than double the median, over $104,000.4 These wage brackets are based on full-time (at least 35 hours/week), year-round (at least 50 weeks/year) wage and salary earnings, or farm or business income. The threshold for middle-earners is extrapolated from the common practice of defining middle class as between two-thirds and twice the median household or family income. See, for instance, the middle-class calculator of the Pew Research Center. To get a better picture of individual workers, IRI looks at a worker’s earnings rather than household or family income.
The IRI analysis shows that 65 percent of immigrants in the United States earn at least a middle wage— 48 percent in middle wage range and an additional 17 percent in the upper-wage bracket of $104,000 or more. Among U.S.-born workers, 74 percent ear at least a middle wage. Among U.S.-born workers, a smaller share are in low-wage jobs, and a larger share in middle-wage jobs.
The share of immigrants and U.S.-born workers in upper-wage jobs is the same: 17 percent. Indeed, the immigrant share continues to match the U.S.-born share even looking at the top five percent and the top one percent of wage earners– indeed, it is slightly higher for immigrants. The top five percent of workers are those who earn $180,000 or more per year. The share of U.S.-born workers earning over $180,000 is almost exactly five percent, while the share of immigrants is slightly higher, 5.6 percent. The top one percent of all workers are those who earn $460,000 or more per year, and again one percent of U.S.-born workers fall in this category matched by a slightly higher share, 1.1 percent of immigrant workers.
Most workers in the U.S. economy are in jobs that pay over the low-wage level of $35,000 per year. By definition, there will always be some workers in bottom rungs of the economy, but it is not necessary for there to be some workers below a certain percentage of the median. Around the world, two thirds of the median is often considered the poverty wage level, and in some countries very few full-time workers fall below that level.
65 Percent of Immigrant Workers Earn At Least Middle Wages
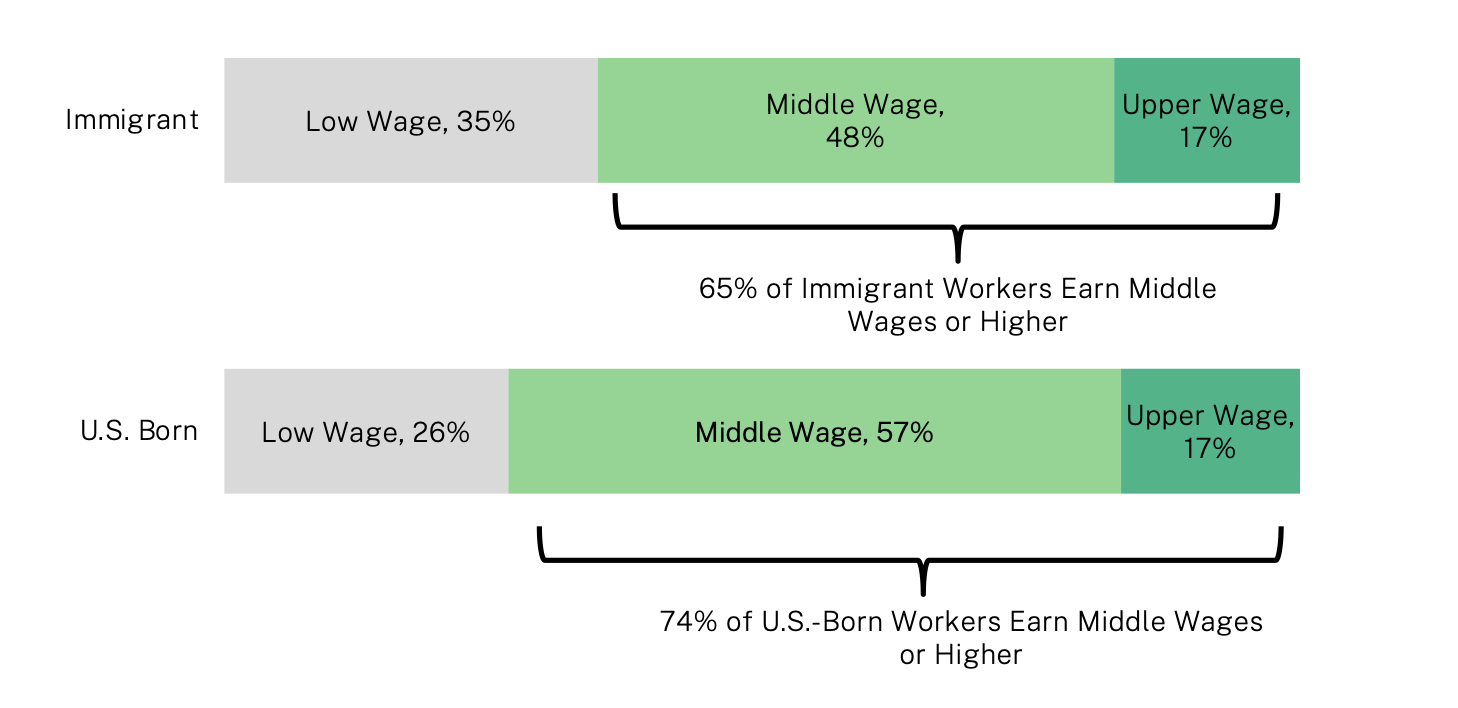
Fig. 1 Immigration Research Initiative analysis of 2021 American Community Survey 5-year data, looking at annual earnings for full-time, year-round workers. “Low wage” is people earning under 2/3 of the median—that is, under $35,000; “middle wage” is from 2/3 to double the median, $35,000 to $104,000, and “upper wage” is earning above $104,000.
In the United States, 26 percent of U.S.-born workers and 35 percent of immigrant workers make under two thirds of the median wage. The immigrants who make up a disproportionate share of this group face numerous barriers in the labor market, from language to educational attainment, recognition of credentials, immigration status or discrimination in the workplace. Of the 33 million workers in the United States in low-wage jobs, 7 million are immigrants and just over 25 million are U.S.-born.
2. Race and Gender Are A Big Factor in Economic Outcomes
Immigrants and U.S.-born residents work in jobs across the economic spectrum, and so do people in all race and gender groups. However, workers are not spread evenly.
Figure 1 shows that race and gender5While IRI recognizes that gender is not binary and that not all Americans are either men or women, the American Community Survey and U.S. Census Bureau only account for two genders. are significant factors in determining economic outcomes. White and Asian/Pacific Islander men, both U.S.-born (82 percent) and immigrants (84 percent), are the most likely to earn middle and upper wages. U.S.-born Black workers are far less likely to earn a decent wage for full-time work. The same is true for foreign-born Black women, though not as much for foreign-born Black men.
Hispanic/Latinx6In this analysis, white refers to non-Hispanic white, Black to non-Hispanic Black, Asian to non-Hispanic Asian American and Pacific Islanders—sometimes shortened to AAPI or to “Asian,” and Hispanic or Latinx refers to people of any race who respond to the Census Bureau that they of Hispanic, Latino, or Spanish origin.immigrants are the group that faces the greatest hardship. The number of Latinx immigrants making low wages highlights the economic struggles of a group of Americans who are often the target of hateful anti-immigrant rhetoric, actions of the U.S. deportation regime, and workplace abuses, as well as barriers they may face due to level of formal education or English language ability. Just 58 percent of Latinx men and a strikingly low 42 percent of Latinx women born outside the United States make more than the low-wage threshold of $35,000.
Latinx Americans who are U.S. citizens by birth have about the same degree of middle- to upper-wage earnings as U.S.-born Black Americans—far below that of white and Asian workers, but higher than foreign-born Latinx workers. Among U.S.-born Latinx men, 66 percent make more than $35,000 per year, as do 58 percent of women.
Among Asian American and Pacific Islanders, a nearly equal share of U.S.-born women (80 percent) and men (81 percent) earn middle- and upper-wages. Eighty-one percent of immigrant AAPI men are in these categories, as are 73 percent of immigrant AAPI women.
Share of Workers in Middle- And Upper-Wage Jobs Combined
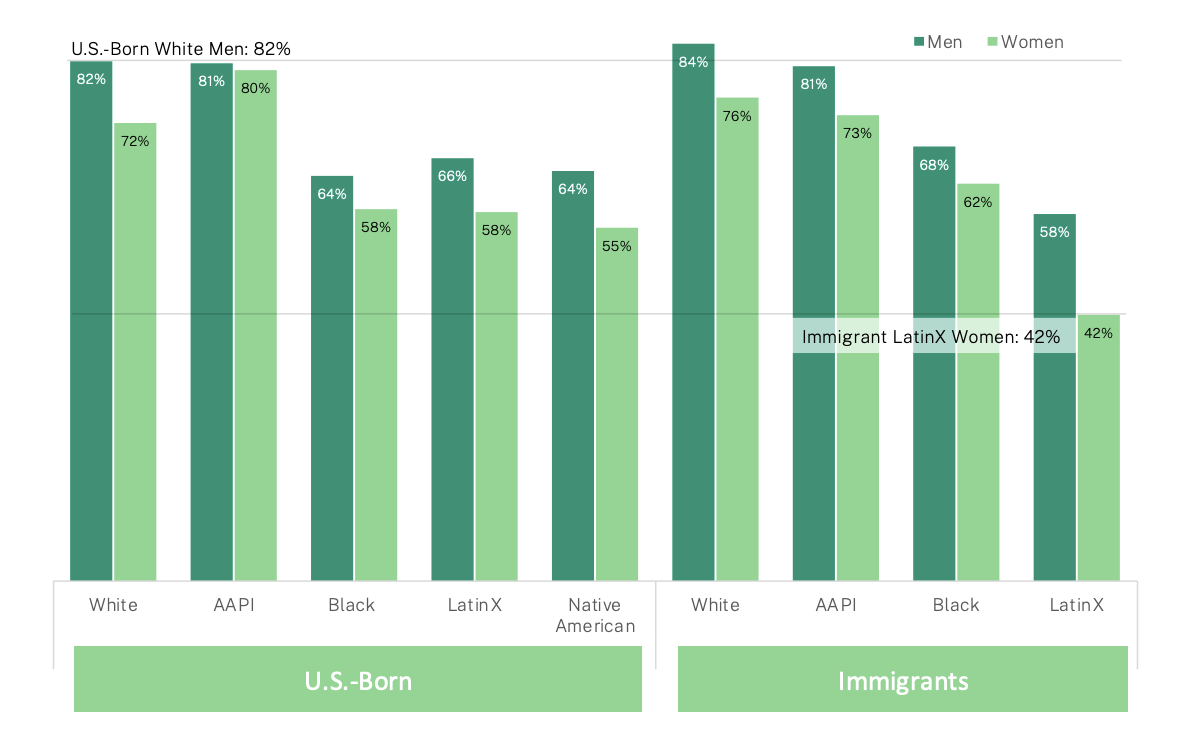
Fig 2. Immigration Research Initiative analysis of 2021 American Community Survey 5-year data. Full-time workers earning over $35,000, that is: more than 2/3 of the median for full-time workers.
Also notable is the large gap in earnings between white men and white women. Whether U.S.-born or immigrants, the share of workers making middle- or upper-wages is more than 10 percentage points higher for men in both cases. This gendered gap in wages is echoed among immigrant Latinx men and women (16 percentage points) and immigrant Black men and women (8 percentage points).
The Divisions Are Starkest in Upper-Wage Occupations
Figure 2 looks at all workers who earned at least $35,000– combining the middle- and upper wage categories. Figure 2 zooms in to look just at those workers in the upper-wage range, people who earned at least $104,000 between 2016 and 2021.
The economic disparities in the share of people earning upper-wages are even starker. White and AAPI men stand out most significantly, particularly those who are immigrants. Among U.S.-born workers, about a quarter of white (24 percent) and AAPI (28 percent) men make more than $104,000. Among immigrants, the rates are even higher, with 37 percent of foreign-born white men and 36 percent of foreign-born AAPI men earning upper wages. No other groups in our analysis approach this level of concentration in upper-wage jobs.
Foreign-born AAPI women come closest to this level of concentration in the upper-wage category at 23 percent, followed by immigrant white women (22 percent), U.S.-born Asian women (22 percent), U.S.-born white women (12 percent), and immigrant Black men (12 percent). Less than 11 percent of workers in all other groups earn high wages, including 6 percent of U.S.-born black women, 5 percent of Native American women, and 4 percent of immigrant Latinx women who are at the intersection of racial and gender bias, and have the worst economic outcomes overall in the American economy.
Upper-Wage Earners Alone: Those Making Over $104,000
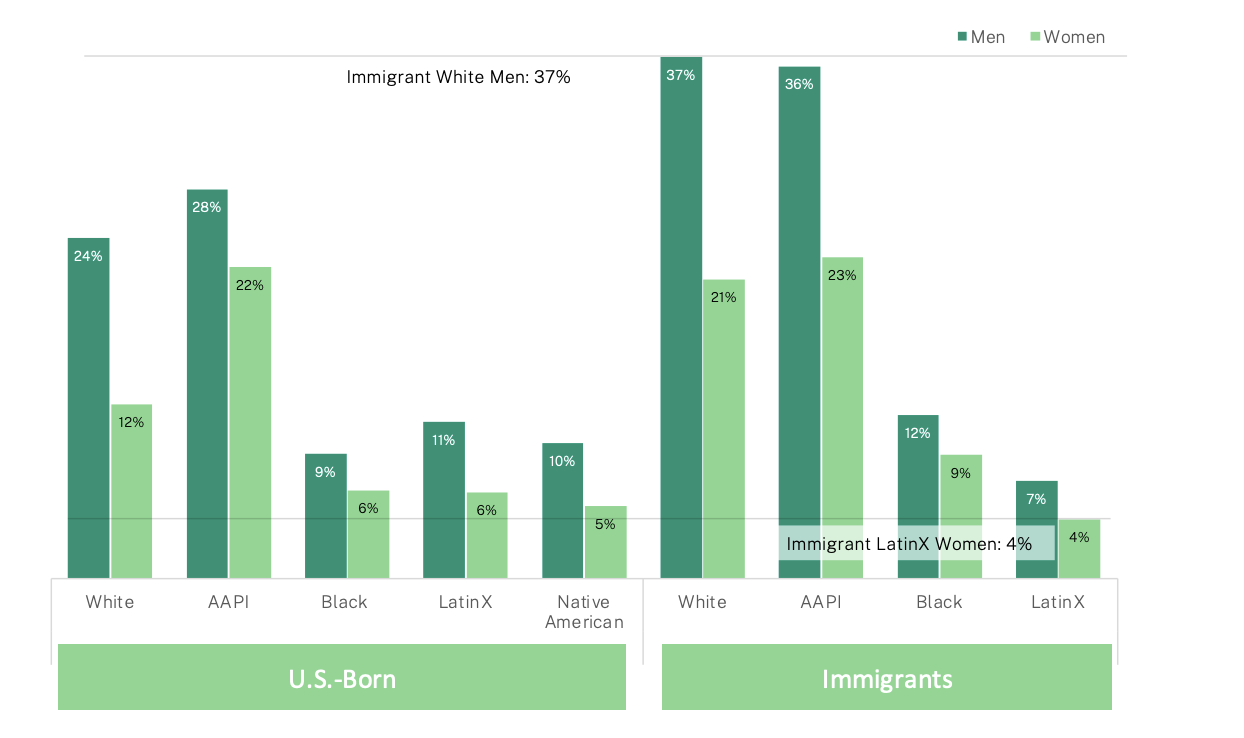
Fig 3. Immigration Research Initiative analysis of 2021 American Community Survey 5-year data. Full-time workers earning over $104,000, that is: more than double the national median for full-time workers.
Black and Latinx Workers Trapped in Low-Wages Jobs
Working full time and earning under $35,000 per year leaves many workers in every demographic group struggling to make ends meet. There are, however, clear race, gender, and immigration components that contribute to who is mostly likely to be in these low-wage jobs in the United States.
Foreign-born white men (16 percent) are the least likely to be trapped in low-wage work. Among white people in the U.S., whether immigrants or U.S.-born, the share in middle-wage jobs is similar across gender and nativity. The share of people in middle-wage jobs for white men and women, U.S.-born and immigrants, is between 47 and 60 percent (not shown in charts). The significant difference among white Americans is that far fewer white women earn upper wages, and far more earn low wages.
The economic disparities in favor of white men are even more drastic when we consider race as a variable. The percentage of men of color who earn less than $35,000 annually in the United States is much closer to that of immigrant workers than U.S.-born workers. For example, 36 percent of U.S.-born Black men earn low wages, as do 34 percent of U.S.-born Latinx men. About 55 percent of all U.S.-born men in both racial groups are in middle wage and 9 percent of U.S-born Black men in the United States make more than $104,000 along with 11 percent of U.S.-born Latinx men.
Women of color face even more economic struggles than their male counterparts (Figure 3). Black and Latinx women are all more likely to earn low wages (42 percent each) and less likely to fall into the upper-wage category. Only 5 percent of U.S.-born Black and Latinx women are in upper-wage jobs.
Low Wage Workers: Getting By on Under $35,000 Per Year
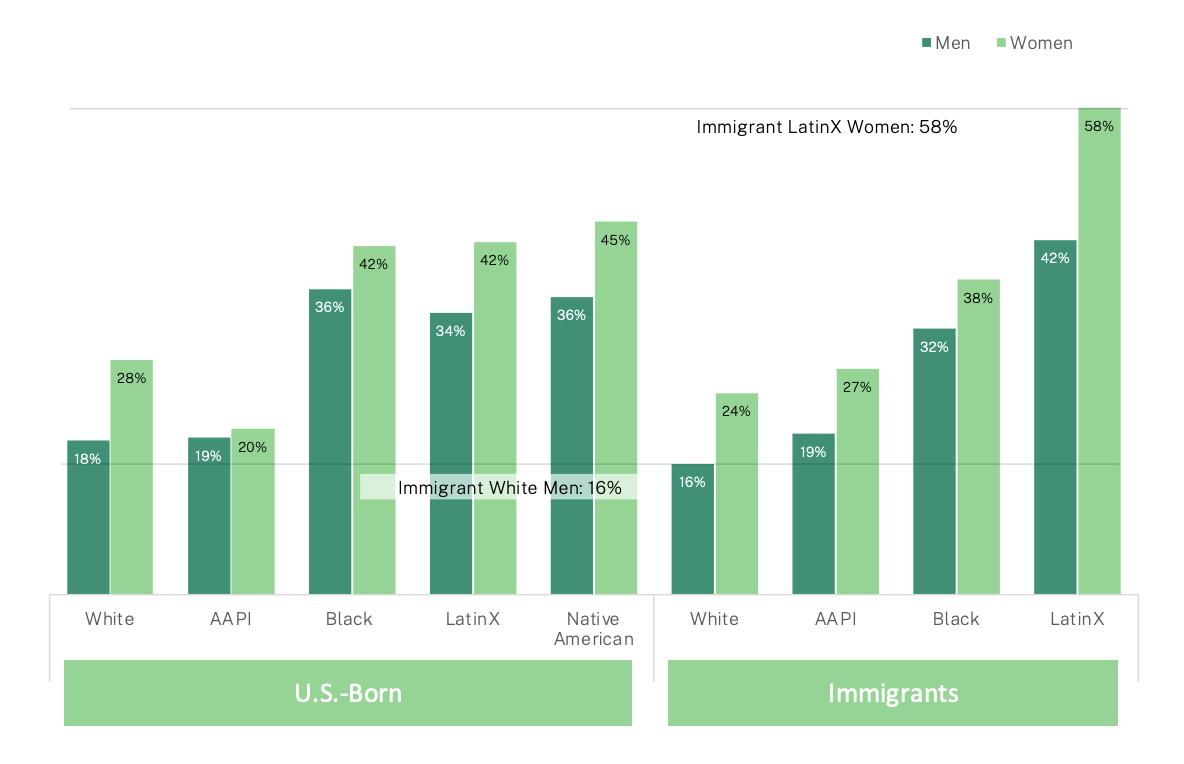 Fig 4. Immigration Research Initiative analysis of 2021 American Community Survey 5-year data. Full-time workers earning under $35,000, that is: less than 2/3 the median for full-time workers.
Two-fifths of all Native Americans who worked full-time jobs earned low wages, 53 percent earned middle wages, and 8 percent earned upper wages. There were gendered differences here, too, as 36 percent of U.S.-born Native American men earned low wages, compared to 45 percent of Native American women born in the United States.
Overall, most workers in the U.S. are in jobs where they make middle wages- and upper-wages, but there are stark differences among diverse groups. Race, gender, and nativity all stand out as significant factors impacting individuals’ economic outcomes in the United States. U.S.-born Black and Latinx workers, as well as foreign-born Latinx workers, are significantly less likely to earn middle- and upper-wages than other workers. Women are also much less likely than men to make a decent wage—in many cases strikingly so. These findings highlight what many Americans, especially women and Black and Indigenous People of Color, already know to be true form their own experiences. What is important to note is that the impacts systemic racism, class inequality, misogyny, and nativism are clearly quantifiable and create very real disparities regarding individuals’ ability to succeed in the economy.
3. What Low-, Middle-, and Upper-Wage Occupations Look Like
For this analysis we categorize each occupation as either low, middle, or upper-wage using the same criteria as in the previous analysis: low-wage is under $35,000 per year (2/3 of the median), middle-wage is $35,000 to $104,000 (double the median), and upper-wage is above $104,000.7 Note that this analysis considers the median wage for each occupation and then looks at which workers are in these occupations. This correlates closely with, but is not exactly the same as, looking at the median wages for groups of workers. Occupations are categorized as low, middle, or upper-wage based on the median wage for immigrants in that occupation.
Low-Wage Work in the U.S.
Among low-age occupations, by far the most common for immigrants are in service occupations. Some of 480,000 work as janitors and building cleaners, with median wage of $30,000 and 360,000 as hour cleaners, with a median wage of $25,000. Many other work in restaurants, including 421,000 cooks, with a median wage of $27,000, 166,000 waiters earning a median wage of $27,000, and 118,000 food preparation workers, with a median wage of $26,000.
More than 547,000 immigrants work in low-wage occupations in the healthcare industry, including 222,000 who work as nursing assistants, with a median wage of $33,000, 211,000 personal care aides, and 108,000 home health aides all of whom earn a median of $30,000.
In all, 3 million immigrants working full-time, year-round are in service occupations, as are 19 million U.S.-born workers. Immigrants make up 30 percent of all service workers, well higher than immigrants’ 17 percent share of the labor force overall.
There are also many immigrants working in production occupations, most often as “miscellaneous production workers.” But, the number of production workers includes 84,000 packaging machine operators, where the median wage is $30,000, along with 69,000 butchers and meat processors who make a median wage of $33,000 and 52,000 sewing machine operators earning a median wage of just $26,000.
There are 875,000 immigrants working in transportation occupations, many of which are low-wage jobs. There are, for example, 135,000 immigrants working as taxi drivers, accounting for more than half (57 percent) of all Americans in that occupation, earning a median wage of $32,000. Immigrants work in a range of other transportation jobs as well, including 143,000 immigrants who work as packers and packagers—more than two-fifths (42 percent) of all packagers in the nation—and an additional 148,000 stockers and order fillers. The median wage for immigrants working these jobs—in an industry largely driven by online shopping—is $27,000 for packagers and $31,000 for order fillers. Another 16,000 immigrants work as garbage collectors for a median wage of just $30,000.
An additional 468,000 immigrants work low-wage retail jobs, including 240,000 retail salespeople who earn a median wage of $33,000 and 229,000 cashiers with a median wage of $25,000.
It is worth noting that most immigrants in low-wage jobs– 58 percent to be precise– work either in service or production jobs. There are 3 million immigrants working in service jobs and 890,000 in production occupations.
It is difficult to get precise wage data for undocumented immigrants, but there is little doubt that the large majority work in low-wage jobs, or perhaps slightly above. There are estimated 7 million workers who are undocumented in the U.S. labor force, according to estimates from the Center for Migration Studies, with a higher percentage of them year-round, full-time workers. At a rough estimate, undocumented immigrants may make up around half of all low-wage workers who are immigrants. Among workers who are undocumented, 29 percent work in service jobs, one fifth each in production (18 percent), construction, maintenance, and related jobs (24 percent), 17 percent in managerial and professional specialty occupations, and 11 percent in technical, sales, and administrative support.
Finding Space in the Middle
Immigrants in middle-wage occupations work in a very wide array of positions: nurses, computer programmers, educators, architects, logistics specialists, emergency services staff, and more.
The single most common occupation of immigrants in this middle-wage category is managers. There are 1.6 million immigrants in the U.S. who work as managers in a broad range of fields. In fact, 14 percent of all managers in the U.S. are immigrants. Some common managerial jobs for immigrants include healthcare managers, financial managers, and food service managers. The median wage for immigrants who work as healthcare managers—of which there are 80,000—is $81,000, compared to $94,000 for 182,000 financial managers, and $46,000 for 171,000 food service managers.
Immigrants also play a vital role at all levels of the healthcare sector. In terms of middle-wage health care occupations, there are 414,000 immigrants working as registered nurses, with a median immigrant wage of $83,000 making up 17 percent of all workers in that occupation. There are also 303,000 healthcare technicians and assistants, including 82,000 licensed vocational nurses making a median wage of $50,000, 52,000 lab technicians with a median of $58,000, and 33,000 pharmacy technicians making just $38,000 as the median wage.
There are several middle-wage transportation occupations as well. More than a half million (549,000) immigrants work as truck drivers for a median wage of $44,000. Immigrants account for 19 percent of all truck drivers in the U.S. There are 35,000 transit bus drivers who are immigrants, earning a median wage of $47,000, making up 22 percent of all transit bus drivers.
Another 490,000 immigrants work as retail and sales supervisors (14 percent of the total), and 361,000 work as salespeople in a range of industries. This includes 110,000 wholesalers with a median wage of $58,000, 78,000 real estate brokers who earn a median wage of $57,000, and 47,000 insurance sales agents, for whom the median wage is $52,000.
Additionally, there are 303,000 architects and engineers in the U.S. who were born outside of the U.S. (17 percent of the total), as were 116,000 production supervisors (15 percent of the total), 252,000 aviation and auto repair workers (16 percent), and 61,000 electrical installers and repairers (14 percent), and 568,000 people working in the computer science fields (20 percent). Median wages for these range from $47,000 for electrical installers and $103,000 for workers in the engineering fields. That includes 84,000 computer programmers earning a median annual wage of $100,000. There are also 111,000 computer systems analysts and 99,000 computer support specialists with median wages of $95,000 and $80,000, respectively.
There are 533,000 educators who are immigrants—both schoolteachers and college professors —making up 11 percent of all educators. Median wages for educators range from $57,000 for schoolteachers to $85,000 for college professors. While immigrants are extremely underrepresented among educators overall, it is worth noting that while immigrants are a smaller share of schoolteachers, immigrants are a disproportionately high share (24 percent) of college professors.
There are also 119,000 artistic designers (16 percent of the total), 112,000 community and social service staff (16 percent), and 55,000 clergy members and religious workers (11 percent). Median wages here are from$40,000 for religious to $65,000 for artistic designers.
While many immigrants who work in construction are in low-wage jobs as construction laborers, there are also significant numbers in middle-wage construction jobs in the trades, in specialized jobs, or as supervisors. There are 292,000 carpenters who are immigrants, making up 32 percent of all carpenters, along with 111,000 electricians (15 percent), and 79,000 plumbers (17 percent). The median wage for immigrants in the construction trades is $41,000. With immigrants playing a significant role in many construction jobs, U.S.-born workers—often with more established networks, experience on the job, and English-language skills—have been more likely to be construction supervisors. There are 112,000 immigrants in the U.S. who are construction supervisors, making up 18 percent of the total, and earning a median wage of $55,000.
Immigrants in Upper-Wage Jobs
In the U.S., upper-wage occupations are those with a median income for immigrants of $104,000 or higher, more than double the overall median wage for full-time workers.
Of the 2 million immigrants working upper-wage occupations, 934,000 (48 percent) work in computer and science occupations. In fact, immigrants make up 31 percent of all upper-wage computer jobs, including 559,000 software developers (39 percent of the total) with a median wage of $125,000. There are also 60,000 aerospace engineers (27 percent) for who the median is $116,000 and 22,000 aerospace engineers (17 percent) with a median wage of $120,000.
There are also a significant number of immigrants in high-wage healthcare professions, most often as physicians. Immigrants are, in fact, disproportionately likely to be doctors: 28 percent of the 740,000 physicians in the U.S. are immigrants, contributing to the overall well-being of all Americans. The 210,000 immigrants working as physicians go along with 53,000 pharmacists, 28,000 dentists, and 21,000 nurse practitioners. The median wage for immigrants working as physicians is $221,000 compared to $127,000 for pharmacists, $148,000 for dentists, and $113,000 for nurse practitioners.
Another 541,000 foreign-born Americans work in upper-wage occupations in management, business, and finance. That includes 188,000 chief executives and legislators, accounting for 15 percent of workers in that job category. Hundreds more immigrants work upper-wage jobs as financial sales agents and police supervisors.
- 1All data in this report are Immigration Research Initiative analysis based on the 2021 American Community Survey 5-year data. Immigrants here are defined as people born in another country and living in the United States, whatever their immigration status. “Immigrants” includes refugees, asylees, people with green cards, naturalized citizens, people with temporary visas, and immigrants who are undocumented.
- 2We measure economic output as the immigrant share of total earnings, on the assumption that people are paid in proportion to their economic contribution. In the case of immigrants, and indeed for most workers, this is a conservative estimate since workers are often paid less than a fair share of economic output.
- 3Estimate from the Center for Migration Studies.
- 4These wage brackets are based on full-time (at least 35 hours/week), year-round (at least 50 weeks/year) wage and salary earnings, or farm or business income. The threshold for middle-earners is extrapolated from the common practice of defining middle class as between two-thirds and twice the median household or family income. See, for instance, the middle-class calculator of the Pew Research Center. To get a better picture of individual workers, IRI looks at a worker’s earnings rather than household or family income.
- 5While IRI recognizes that gender is not binary and that not all Americans are either men or women, the American Community Survey and U.S. Census Bureau only account for two genders.
- 6In this analysis, white refers to non-Hispanic white, Black to non-Hispanic Black, Asian to non-Hispanic Asian American and Pacific Islanders—sometimes shortened to AAPI or to “Asian,” and Hispanic or Latinx refers to people of any race who respond to the Census Bureau that they of Hispanic, Latino, or Spanish origin.
- 7Note that this analysis considers the median wage for each occupation and then looks at which workers are in these occupations. This correlates closely with, but is not exactly the same as, looking at the median wages for groups of workers.