The United States refugee resettlement program helps people from some of the most dramatically troubled situations around the world to find a home in the United States.
Refugees are people who the government has determined have a well-founded fear of persecution, have gone through an extensive vetting process, and who have typically waited many years before arriving in the United States. Among the top countries of origin for refugees over the past decade are Myanmar (Burma), Iraq, Bhutan, Democratic Republic of Congo, Somalia, Iran, Syria, Cuba, and Ukraine. In the U.S., the refugee resettlement program is a public-private partnership of the Bureau of Population, Refugees and Migration, the Department of Health and Human Services, and nine national resettlement agencies.
Over the past 10 years, the states that have received the most refugees have been Texas (44,000), California (40,000), New York (27,000), and Michigan (23,000).
Nebraska Tops the List of Refugee Arrivals Per Capita
| Refugee Arrivals in Past 10 Years | Refugee Arrivals per 100,000 State Population | Refugee Arrivals per 100,000 immigrants in State | ||
| 1 | Nebraska | 7,450 | 379 | 5,158 |
| 2 | North Dakota | 2,930 | 378 | 8,662 |
| 3 | Idaho | 6,577 | 346 | 5,700 |
| 4 | Kentucky | 14,671 | 325 | 8,061 |
| 5 | South Dakota | 2,793 | 312 | 9,015 |
| 6 | Vermont | 2,001 | 310 | 7,356 |
| 7 | Arizona | 19,950 | 274 | 2,178 |
| 8 | Washington | 20,454 | 264 | 1,789 |
| 9 | Minesota | 13,944 | 244 | 2,861 |
| 10 | Michigan | 22,769 | 227 | 3,332 |
| 11 | Utah | 7,031 | 211 | 2,526 |
| 12 | New Hampshire | 2,672 | 192 | 3,253 |
| 13 | Iowa | 6,118 | 192 | 3,536 |
| 14 | Colorado | 10,547 | 181 | 1,849 |
| 15 | Maine | 2,481 | 181 | 4,425 |
| 16 | Ohio | 20,892 | 177 | 3,572 |
| 17 | North Carolina | 17,333 | 164 | 1,993 |
| 18 | Oregon | 6.933 | 163 | 1,681 |
| 19 | Kansas | 4,711 | 161 | 2,333 |
| 20 | Missouri | 9,897 | 160 | 3,939 |
| 21 | Georgia | 17,170 | 159 | 1,585 |
| 22 | Indiana | 10,570 | 155 | 2,786 |
| 23 | Massachusetts | 10,488 | 150 | 854 |
| 24 | Wisconsin | 8,743 | 148 | 2,907 |
| 25 | Texas | 43,527 | 147 | 855 |
| 26 | Maryland | 9,037 | 147 | 923 |
| 27 | Tennessee | 9,791 | 140 | 2,641 |
| 28 | Pennsylviania | 17,723 | 137 | 1,888 |
| 29 | New York | 26,586 | 134 | 600 |
| 30 | Rhode Island | 1,460 | 133 | 916 |
| 31 | Illinois | 16,219 | 128 | 899 |
| 32 | Nevada | 3,805 | 121 | 656 |
| 33 | Virginia | 8,960 | 104 | 837 |
| 34 | Alaska | 740 | 101 | 1,253 |
| 35 | California | 39,509 | 101 | 378 |
| 36 | Connecticut | 3,481 | 97 | 634 |
| 37 | Florida | 17,104 | 79 | 371 |
| 38 | New Mexico | 1,555 | 73 | 807 |
| 39 | Oklahoma | 2,504 | 63 | 1,086 |
| 40 | Montana | 487 | 44 | 1,991 |
| 41 | South Carolina | 1,985 | 38 | 732 |
| 42 | New Jersey | 2,967 | 32 | 139 |
| 43 | Louisiana | 911 | 20 | 456 |
| 44 | Alabama | 648 | 13 | 367 |
| 45 | Arkansas | 386 | 13 | 270 |
| 46 | Delaware | 127 | 13 | 125 |
| 47 | Washington, D.C. | 66 | 10 | 74 |
| 48 | West Virginia | 142 | 8 | 510 |
| 49 | Mississippi | 71 | 2 | 113 |
| 50 | Hawaii | 18 | 1 | 7 |
| 51 | Wyoming | 1 | 0 | 5 |
| United States | 458,977 | 138 | 1,014 |
Fig. 1 Immigration Research Initiative analysis of Bureau of Population, Refugees and Migration, for placement of refugees by federal fiscal year (ending in September), and 2019 American Community Survey data for state population.
These are all states with a large population. A different way to consider the state role in resettlement is to look at refugee arrivals as a share of the state population.
Taken this way, the states with the highest share of refugees placed may seem surprising. Measuring refugee arrivals as a share 100,000 people in the current state population, are: Nebraska (379), North Dakota (378), Idaho (346), Kentucky (325), South Dakota (312), Vermont (310), and Arizona (274).
A different way to think about resettlement is to calculate refugee arrivals as a share of a state’s overall immigrant population. In some states, refugees are a very substantial part of the overall picture of immigration. In other states, when local residents think about immigrants, refugees are likely to be a small part of that picture. There is a good deal of overlap at the top of the table: Nebraska, North Dakota, Idaho, Kentucky, South Dakota, and Vermont are all among the top states for refugee arrivals per capita and for refugee arrivals as a share of immigrants. But in many states there is a substantial divergence. Maine, for example, is 15th on the list for refugee arrivals per capita, with 181 refugees per 100,000 in the total state population, but 7th for refugees as a share of immigrants, with 4,425 refugees per 100,000 immigrants living in Maine. Missouri is 20th per capita, but 8th as a share of immigrants, and Tennessee is 27th per capita and 16th as a share of immigrants.
Refugee resettlement has also changed dramatically over the past ten years. The president, without action from congress, has a great deal more influence over refugee resettlement than over other aspects of immigration policy. Each year, a cap on the number of refugee arrivals is set by presidential determination. Other factors have an impact on how many refugees are actually resettled, but the total number cannot exceed the cap set by the president.
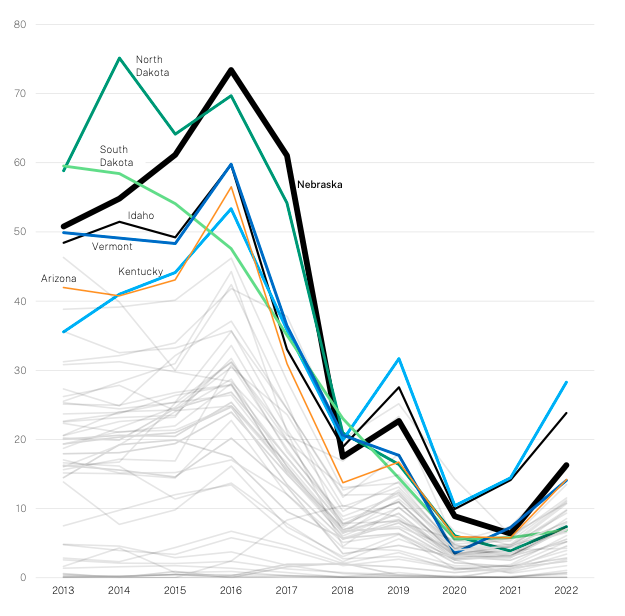
During the Trump Administration, the number of refugee arrivals plummeted from 85,000 in 2016 to just 12,000 in 2020. The 2022 total was 25,000, as resettlement agencies and the overall program picks up the pieces and rebuilds gradually after a precipitous decline.
The ranking of state resettlement per capita has shifted some over this time, but the states generally maintained roughly the relative positions they had before the reduction in numbers. In 2022, Kentucky is the top state for resettlement per capita, Idaho is second, and Nebraska is third.
Refugee Resettlement: Beginning to Rebuild After a Dramatic Decline