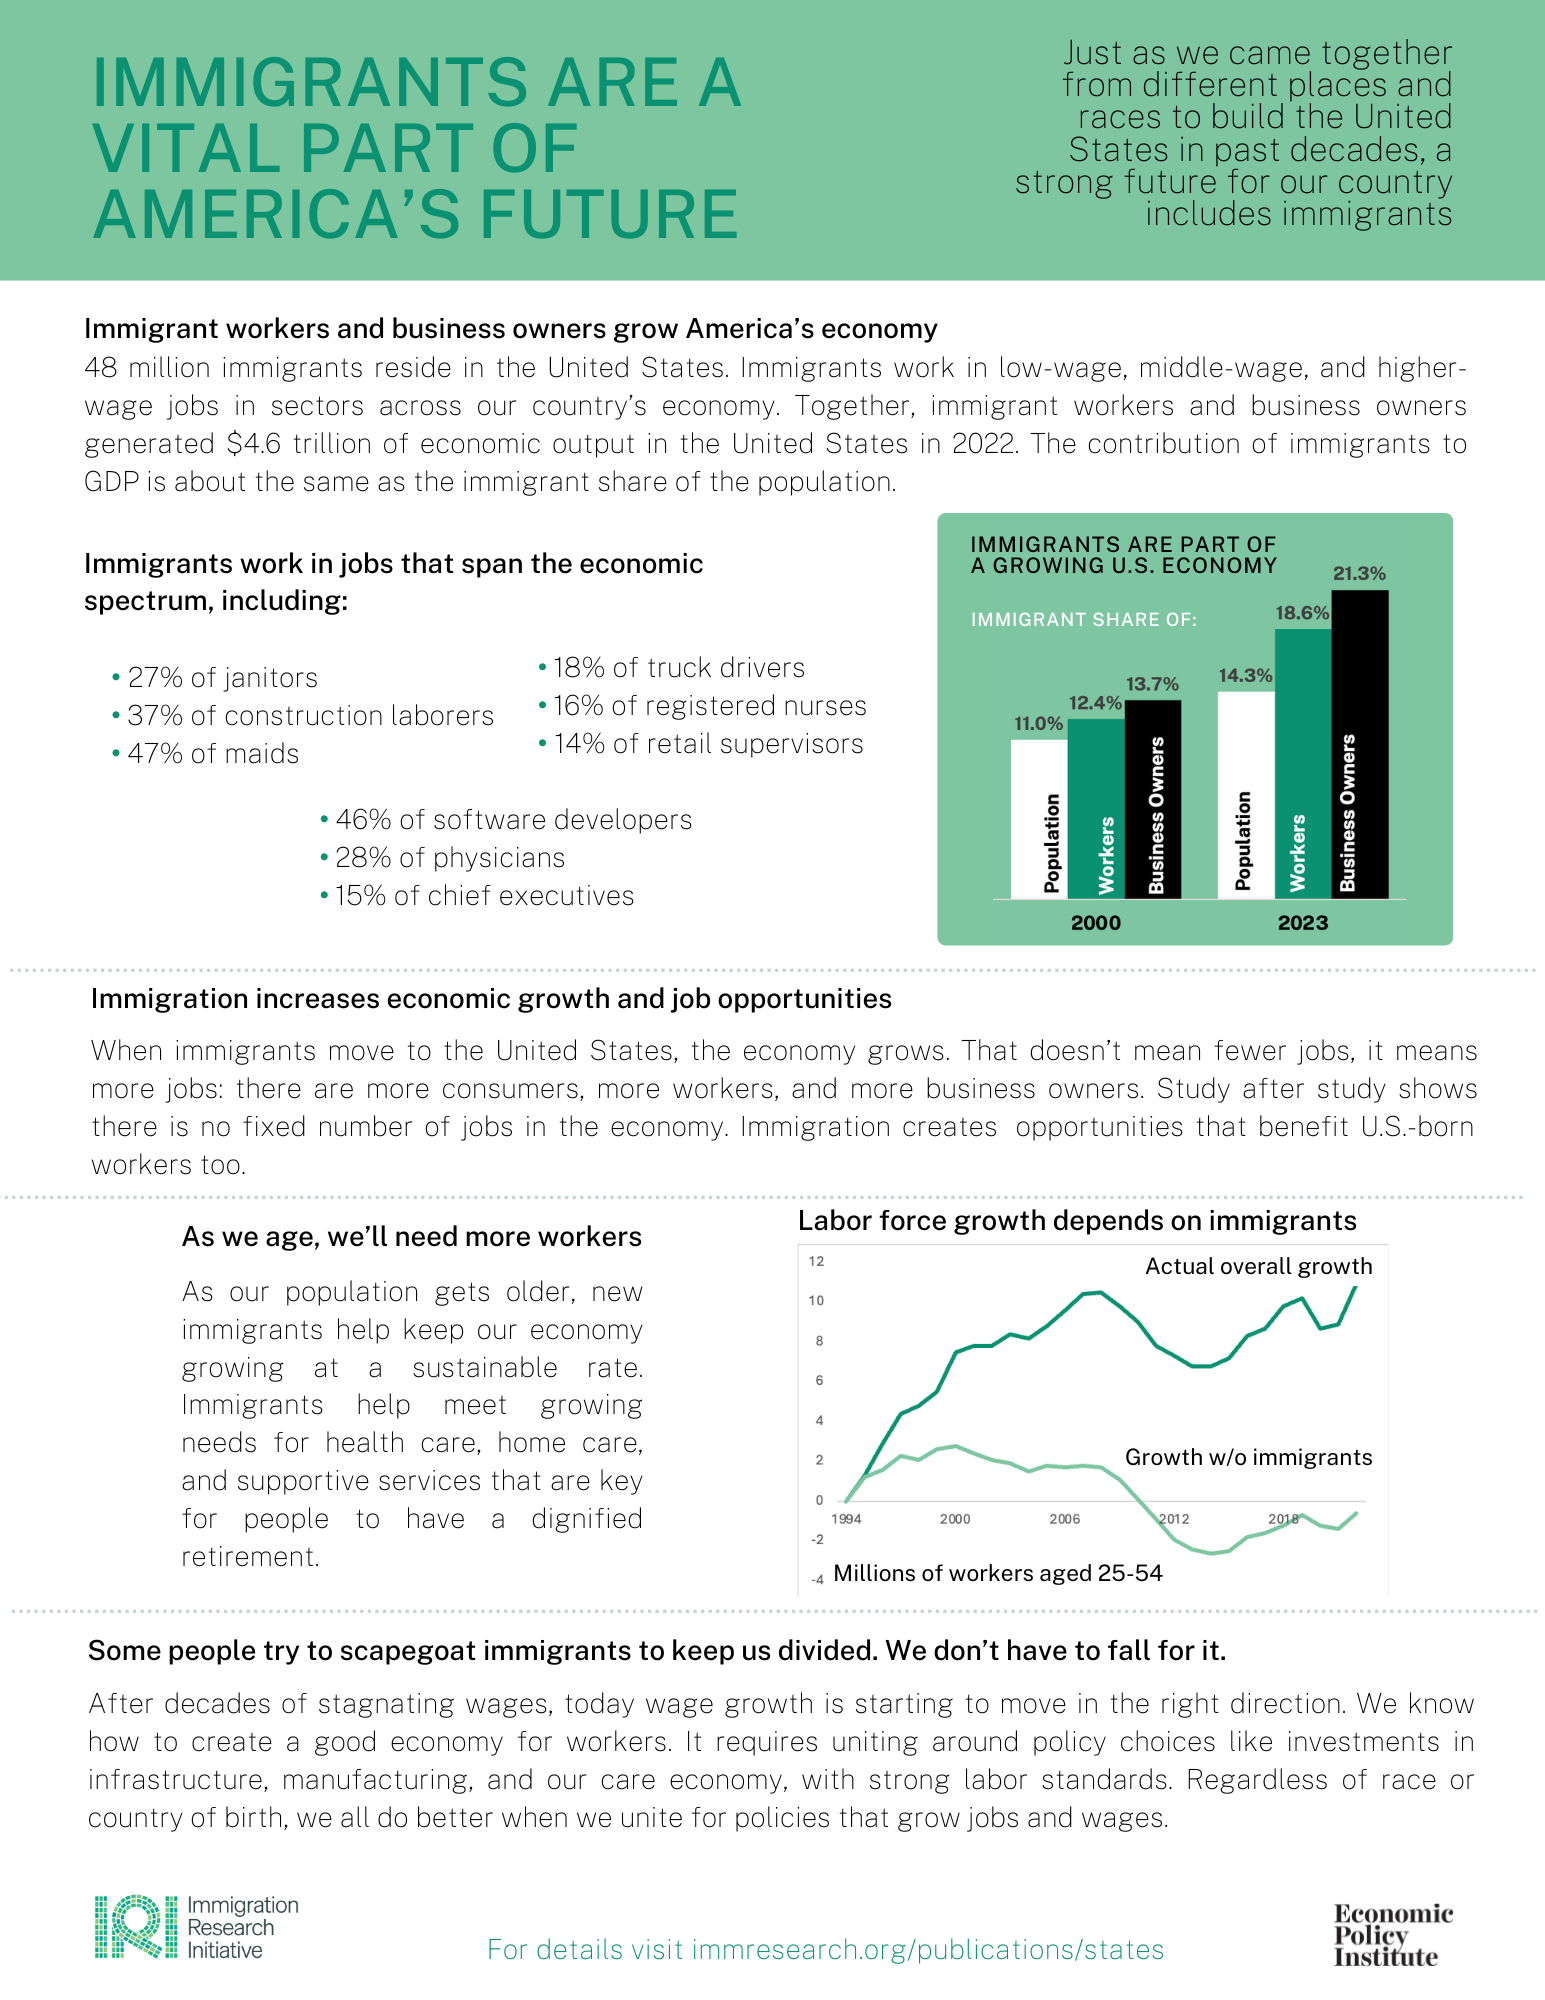
Immigrants Are a Vital Part of America’s Future
 Immigration Research Initiative and Economic Policy Institute are co-publishing a series of one-page summaries of what we know for sure: immigrants are good for economic growth.
Below is the one-pager for the United States. For a printable pdf, go to the link below. Feel free to print and circulate, this is intended for broad use!
And, below are state-level one-pagers, with more to come soon – check back in the weeks ahead!
At the bottom are data sources and technical notes.
State-level reports:
Arizona released with the Arizona Center for Economic Progress in English and Spanish.
Colorado released by the Colorado Fiscal Institute in English and Spanish.
District of Columbia, with the DC Fiscal Policy Institute.
Georgia co-released with the Georgia Budget and Policy Institute.
Iowa co-released with Common Good Iowa.
Maine co-released with Maine Center for Economic Policy.
Massachusetts co-released with the Massachusetts Budget and Policy Center.
Michigan co-released with the Michigan League for Public Policy.
Minnesota co-released with the Minnesota Budget Project.
New Mexico co-released with New Mexico Voices for Children.
New York State and New York City
New Jersey co-released with New Jersey Policy Perspective.
North Carolina co-released with North Carolina Budget and Tax Center.
Ohio co-released with Policy Matters Ohio.
Pennsylvania, co-released with the Pennsylvania Policy Center.
Virginia co-released with The Commonwealth Institute.
Washington State co-released with the Washington Budget and Policy Center in English and Spanish.
Wisconsin co-released with Kids Forward.
Data sources and technical notes:
Data for the United States:
The number of immigrants in the population and the population share are from the American Community Survey 2023. Share of labor force and share of business owners are from the 2023 Current Population Survey. Business owners are defined as people who are self-employed and have an incorporated business. The comparable 2000 data is from the decennial Census.
Immigrant share of economic output, or GDP, is based on the 2022 ACS 5-year data. GDP share is estimated by showing the share of all earned income – wages plus proprietors’ earnings. The GDP dollar amount is calculated by multiplying this share by the total GDP, as reported by the Bureau of Economic Analysis, by the immigrant share. This methodology is explained most fully in the Fiscal Policy Institute’s Working for a Better Life, Appendix B.
Share of immigrants in each occupation are from the 2022 American Community Survey 5-year data.
For information about the impact of immigrants on U.S.-born workers, see for example the academic paper Immigration’s Effect on US Wages and Employment Redux, by Alessandro Caiumi and Giovanni Peri, or a more accessible paper by Peri, Do Immigrant Workers Depress the Wages of Native Workers? The recent sudden increase in immigration coincided with positive outcomes for U.S.-born workers, including some of the fastest wage growth in decades for low-wage workers.
For analysis at the state level (applies to all state data sheets):
Share of immigrants in each occupation are from the 2022 American Community Survey 5-year data, the most recent available that gives a robust sample for detailed analysis.
Trend in population, labor force, and business owners is from 2022 American Community Survey 1-year data, the most recent that allows for inclusion of all three data points.
Business owners are defined as people who are self-employed and own an incorporated business.
Main Street business owners are people who own grocery stores, retail shops, restaurants, dry cleaners, and other businesses that typically populate Main Streets. They are defined in the census data as Retail (from jewelry stores to florists to grocery stores), Accommodation and Food Services (restaurants, bars and hotels), and Neighborhood Services (beauty salons, barber shops, nail salons, dry cleaning, and car washes). The first two are standard industry categories, while the third is the majority of what is generally called “Other Services.” A fuller analysis is available in Bringing Vitality to Main Street: How Immigrant Small Businesses Help Local Economies Grow.
Immigrant share of economic output, or GDP, are estimated by showing the share of all earned income – wages plus proprietors’ earnings. The data source is the 2021 American Community Survey 5-year data. The GDP dollar amount is calculated by multiplying this share by the total GDP, as reported by the Bureau of Economic Analysis, by the immigrant share. This methodology is explained most fully in the Fiscal Policy Institute’s Working for a Better Life, Appendix B.
For information about the impact of immigrants on U.S.-born workers, see for example the academic paper Immigration’s Effect on US Wages and Employment Redux, by Alessandro Caiumi and Giovanni Peri, or a more accessible paper by Peri, Do Immigrant Workers Depress the Wages of Native Workers? The recent sudden increase in immigration coincided with positive outcomes for U.S.-born workers, including some of the fastest wage growth in decades for low-wage workers.