Street Vendors of New York
Overview
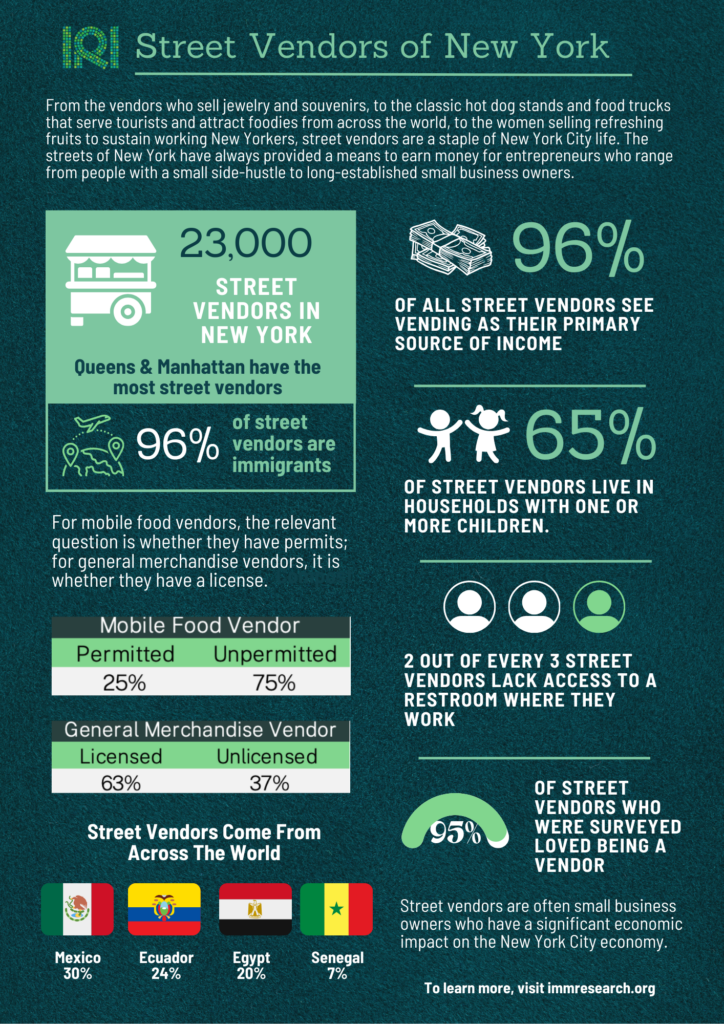
From the vendors who sell jewelry and souvenirs, to the classic hot dog stands and food trucks that serve tourists and attract foodies from across the world, to the women selling refreshing fruits to sustain working New Yorkers, street vendors are a staple of New York City life. The streets of New York have always provided a means to earn money for entrepreneurs who range from people with a small side-hustle to long-established small business owners.
For an industry that is characteristic of life in New York City, we have, until now, known surprisingly little about the vendors that provide the economic activity that ignites so many city streets. How many vendors work in New York City, how much do they earn, what countries are they from, what challenges are they facing, how old are they? This report for the first time gives a comprehensive, empirical answer to these questions.
The report is based on data collected from a comprehensive survey administered to more than two thousand street vendors in 2021 by the Street Vendor Project of the Urban Justice Center. The survey data was analyzed by the Immigration Research Initiative using statistical weights provided by Jonathan Auerbach from George Mason University so that the findings in this report represent the approximately 23,000 street vendors that operate in New York City. The following sections highlight the main findings of that analysis. Further details concerning the survey and the statistical weights are contained within the Methodology section.
23,000 Mobile Food and General Merchandise Street Vendors in NYC
Street vendors are often small business owners that have a significant economic impact on the New York City economy.1Dick M. Carpenter II, Upwardly Mobile: Street Vending and the American Dream, Institute for Justice, October 6, 2015, https://ij.org/report/upwardly-mobile/ There is such a complicated patchwork of New York City and State laws and restrictions around vending that being a fully permitted and licensed vendor can be very difficult. This also makes it difficult to know the exact number of street vendors that operate throughout the city, as many vendors are unlicensed or unpermitted and are missing from administrative datasets. Additionally, it is difficult to identify street vendors from federal surveys, such as the American Community Survey administered by the Census Bureau.
Until now, there has not been a reliable estimate of the number of street vendors working throughout the city.2Previous analyses of street vendors and their economic impact in New York City include “Fiscal Impact of Eliminating Street Vendor Permit Caps in New York City,” by the New York City Independent Budget Office, available at https://ibo.nyc.ny.us/iboreports/Fiscal_Impact_of_Eliminating_Street_Vendor_Permit_Caps_Jan2024.pdf. And, for a more national overview, “Upwardly Mobile,” by Dick M. Carpenter II, published by the Institute for Justice, https://ij.org/wp-content/uploads/2015/10/upwardly-mobile-web-final.pdf “Upwardly Mobile” references about 17,000 vendors and people who work for vendors in New York City in 2016, an estimate based primarily on interviews and rough extrapolation from New York City data sources. The Independent Budget Office report writes “Though the number of street vendors in the City is unknown, some estimates suggest the total number of active vendors in the City may near or exceed 20,000.” Using data from the Street Vendor Project’s comprehensive survey, Jonathan Auerbach used ratio estimation, a common statistical technique for estimating populations, to calculate survey weights and determine the number of street vendors working in New York City, either as business owners or as people employed in those businesses. His study finds that there are approximately 23,000 street vendors operating throughout the five boroughs, the overwhelming majority of which are mobile food vendors (20,500). An additional 2,400 are general merchandise vendors. The total is rounded 23,000 vendors.
Professor Auerbach’s analysis is summarized in the methodology section of this report. The full analysis can be found in “Estimating the Number of Street Vendors in New York City.3Jonathan Auerbach, “Estimating the Number of Street Vendors in New York City,” available at https://jauerbach.github.io/research/auerbach_vendor_2024.pdf.
Who Are Street Vendors?
Nearly All Vendors Are Immigrants
The overwhelming majority of the small business owners and the people who work for them as merchandise and food vendors in New York are immigrants. Nearly all street vendors who are not military veterans, 96 percent, were born in a country outside of the United States. The U.S.-born share represents only 4 percent of street vendors or, put differently, only 4 out of every 100 street vendors, who are not veterans, were born in the United States. For a separate analysis of vendors who are military veterans, see the section “Vendors Who Are Veterans,” later in this report.
Street vending is a common pathway to entrepreneurship for many immigrants because of its comparatively low start-up costs and some other low barriers to entry. However, permitting and licensing caps can inhibit growth and prevent many from meeting the proper standards.4For discussions of the barriers to entry for street vending, other than licensing or permitting, see Lacey Sigmon, “Advocating for Equitable Street Vending Policies,” Progressive City, or Joseph Pileri, “Who Gets to Make a Living? Street Vending in America,”Georgetown Immigration Law Journal, 2021, volume 1.
Among immigrants who are mobile food vendors, 39 percent are naturalized citizens or permanent residents, 27 percent report that they are undocumented, and 30 percent prefer not to answer. Among general merchandise vendors who are immigrants, about two thirds (67 percent) are naturalized citizens or permanent residents, 13 percent report that they are undocumented, and 19 percent prefer not to answer.
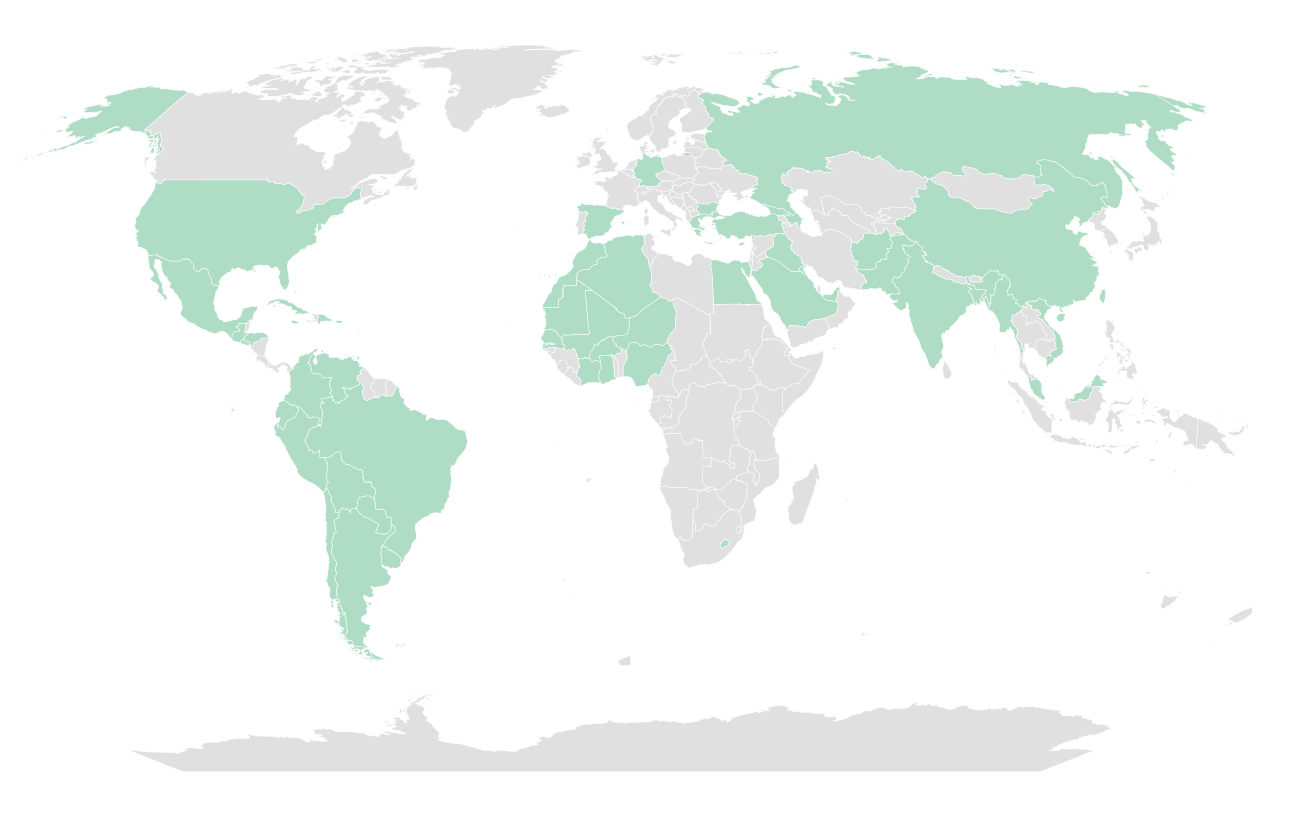
Street Vendors Come from Across the World
Sixty countries were represented by the vendors who participated in this survey, and 16 of these countries were represented by 10 or more vendors.
The majority of vendors in this survey hailed from Central and South American countries, as well as North and West Africa, and East and South Asia. The top five countries of origin for all street vendors are Mexico (30 percent), Ecuador (24 percent), Egypt (20 percent), Senegal (7 percent), and the United States (4 percent).
Street Vendors Came to New York City From Across the World
Street Vendors are Predominantly People of Color
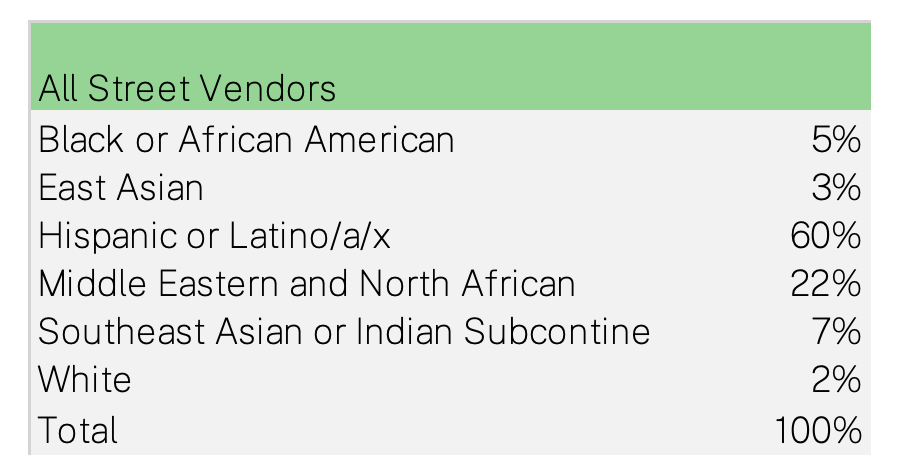
Note: This shows only one race; some people are more than one race.
Over half of all street vendors (60 percent) are Hispanic/Latino/a/x followed by Middle Eastern/North African vendors (22 percent) East/South East Asian vendors (7 percent), Black/African American vendors (5 percent), white vendors (2 percent), and Native American vendors (1 percent). This leaves many implications for enforcement and how that will disproportionately impact Black and Brown immigrants.
Most Merchandise Vendors Are Black, Most Food Vendors Are Latino/a/x
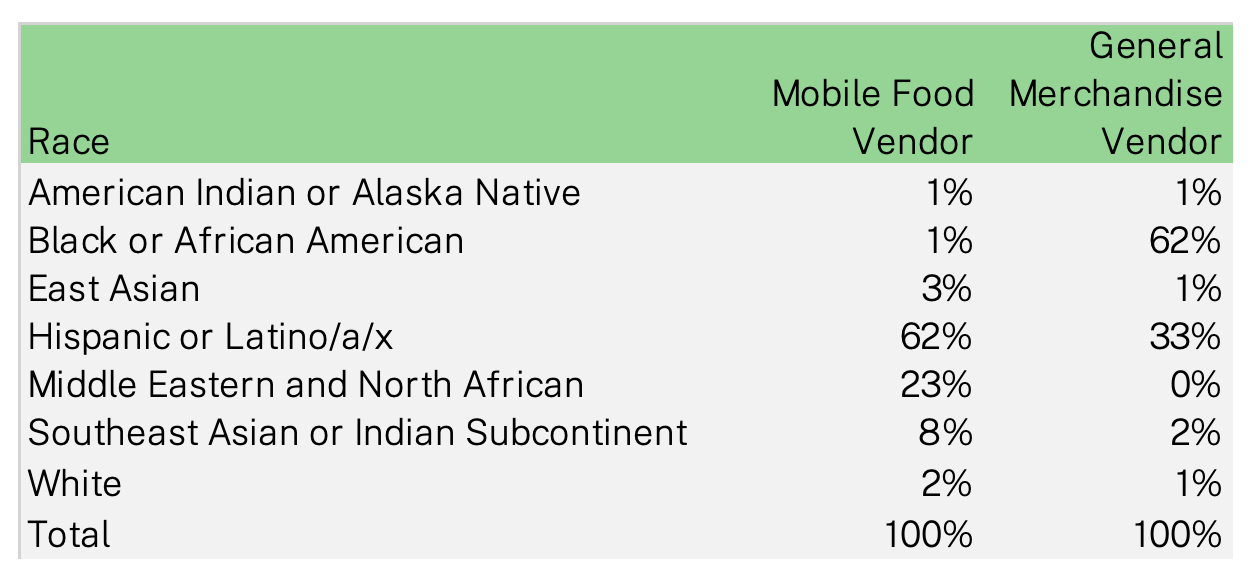
Note: This shows only one race; some people are more than one race.
What type of vending people do differs significantly by race: the majority of mobile food vendors are Hispanic/Latinx while the majority of general merchandise vendors are Black or African American.
Permits and Licensing
There are an estimated 20,500 mobile food vendors and 2,400 general merchandise vendors. For mobile food vendors, the relevant question is whether they have permits; for general merchandise vendors, it is whether they have a license.
Most Merchandise Vendors Have Licenses; But Only A Quarter of Food Vendors Have Permits
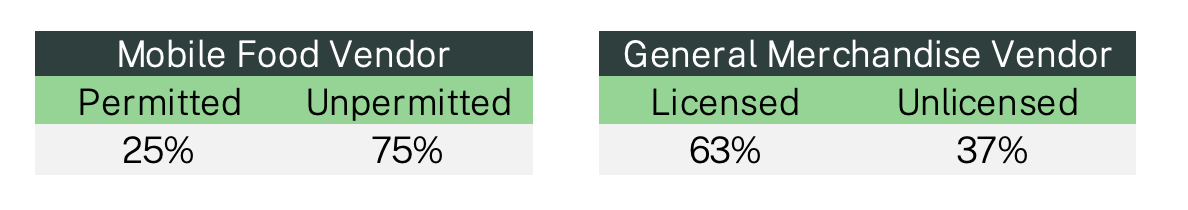
According to the survey analysis, about three-quarters of mobile food vendors are unpermitted, with about a quarter permitted. By contrast, most nonveteran general merchandise vendors are licensed: 63 percent have a license, compared with 37 percent who do not. (We assume all veteran general merchandise vendors are licensed since the license cap does not apply to veterans.)
The number of general vendor licenses that are issued to non-veterans is limited, by law, to 853. As of October 2023, the waiting list for general vendor licenses contains 10,992 individuals and has been closed since 2016.
Top Countries of Birth for Vendors
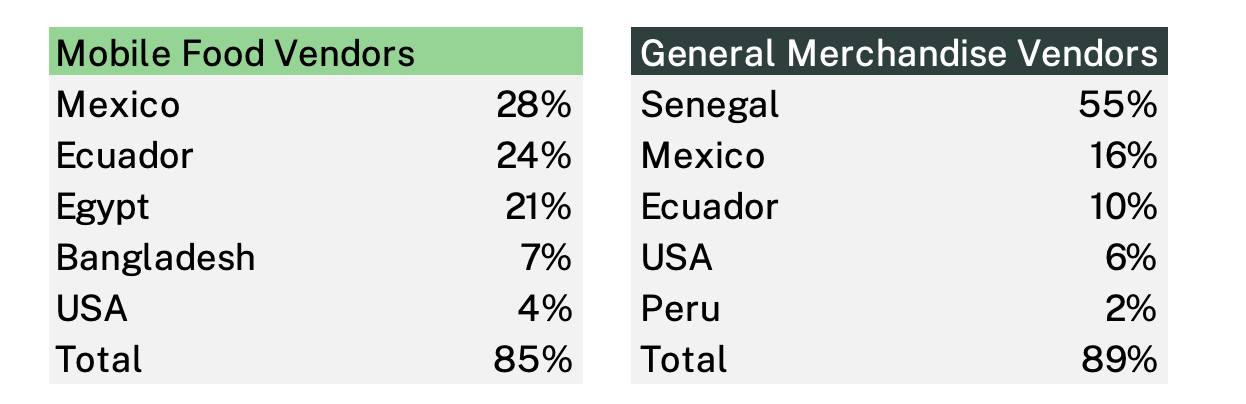
Among people who work as mobile food vendors, the top countries of birth are Mexico (28 percent) Ecuador (24 percent), and Egypt (21 percent), Bangladesh (7 percent) and the United States (4 percent).
For general merchandise vendors, the top countries of birth are Senegal (55 percent), Mexico (16 percent), Ecuador (10 percent), the United States (6 percent) and Peru (2 percent).
Immigrant communities that have been in the United States for longer are more likely to have become established among vendors with permits. Immigrants who are undocumented are more likely to be unlicensed or unpermitted, though many vendors who report being undocumented do have licenses and permits. Vendors can apply for these city documents using an Individual Taxpayer Identification Number (ITIN), irrespective of their immigration status.5See Frank Lombardi, “Vendors Signed on Bill to Ban Immig Probe,”New York Daily News, July 12 2005, https://www.nydailynews.com/2005/07/12/vendors-sold-on-bloomberg-signs-bill-to-ban-immig-probe/
Women play a big role as vendors, but are less likely to have licenses or permits
Women Make Up Half of Food Vendors And Two Thirds of Merchandise Vendors…
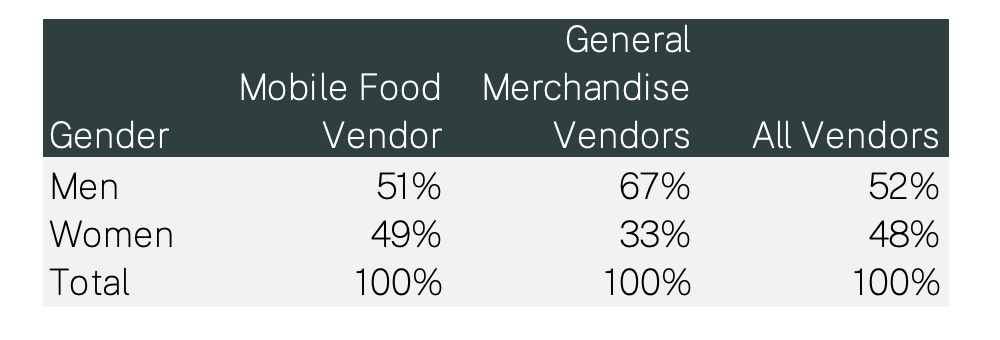
Overall men and women are equally represented amongst street vendors however women are more likely to be mobile food vendors vs. general vendors . The slight majority of mobile food vendors are men, 51 percent.
…But Women Entrepreneurs Are Most Likely to Lack Permitting or Licenses
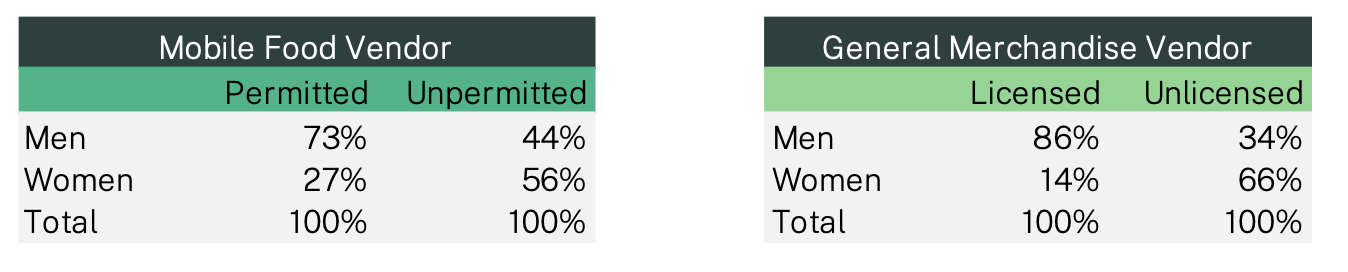
Women who are mobile food vendors are more likely to be unpermitted, only 27 percent of mobile food vendor permit holders are women. This is higher than the findings for women who are general merchandise vendors. Of general merchandise vendors only 14 percent of those who are licensed are women. Women are less likely to have licenses and permits, reflecting the difficulty that people face when trying to obtain a vendor permit.6For more on the role of women in street vending, and the added challenges they face, see “Vulnerable in Itself: Results and Recommendations from a Study of Women Street Vendors in New York City, October 2019, Urban Justice Center, https://www.scribd.com/document/432317126/Vulnerable-in-Itself.
Vending in New York City
What Street Vendors Sell
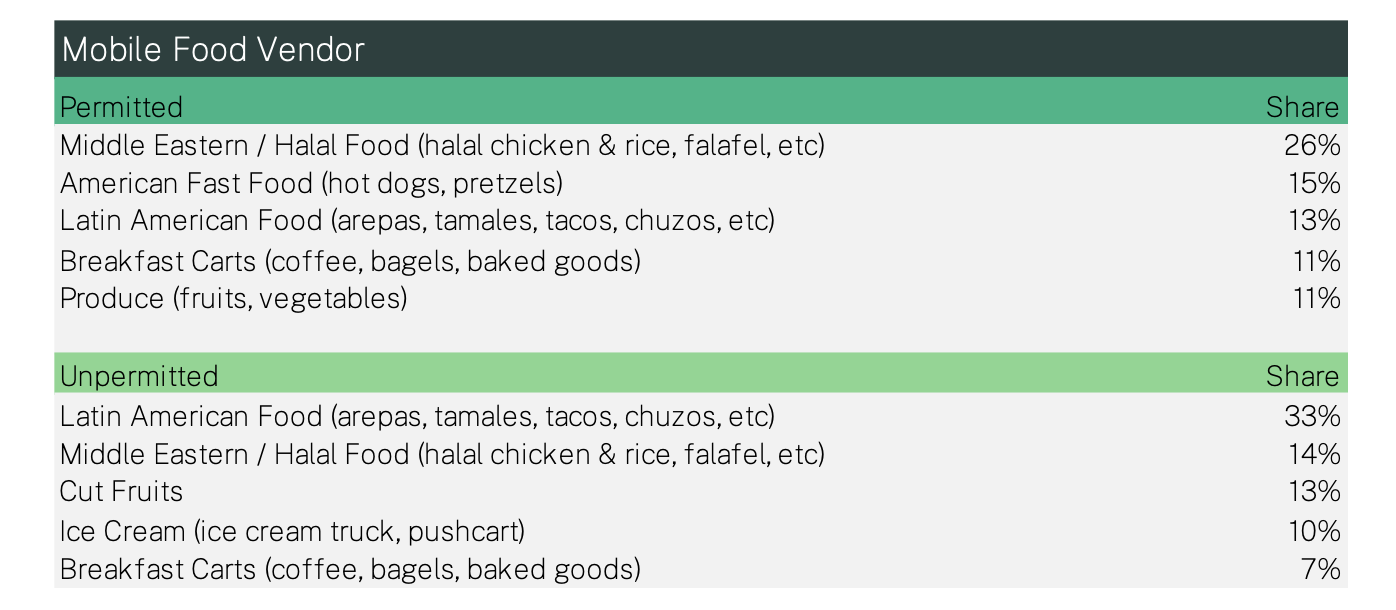
Mobile food vendors reported selling 21 different types of foods, ranging from Latin American food, to classic American fast food like hot dogs. There are both similarities and differences in the goods sold by vendors who are permitted/licensed and those who are not.
Halal carts are prominent in the list of both food vendors with and without permits, topping the list and making up 26 percent of those with permits. Among permitted vendors, the other popular items are hot dogs and pretzels, bagels and muffins and coffee.
Among unpermitted carts, it’s the Latin American foods that top the list, with 33 percent selling arepas, tacos, or chuzos. Cut fruits and ice cream are also high on the list among unpermitted food vendors.
Types of Food Sold By Vendors With and Without a Permit
Types of Merchandise Sold By Vendors With and Without a License
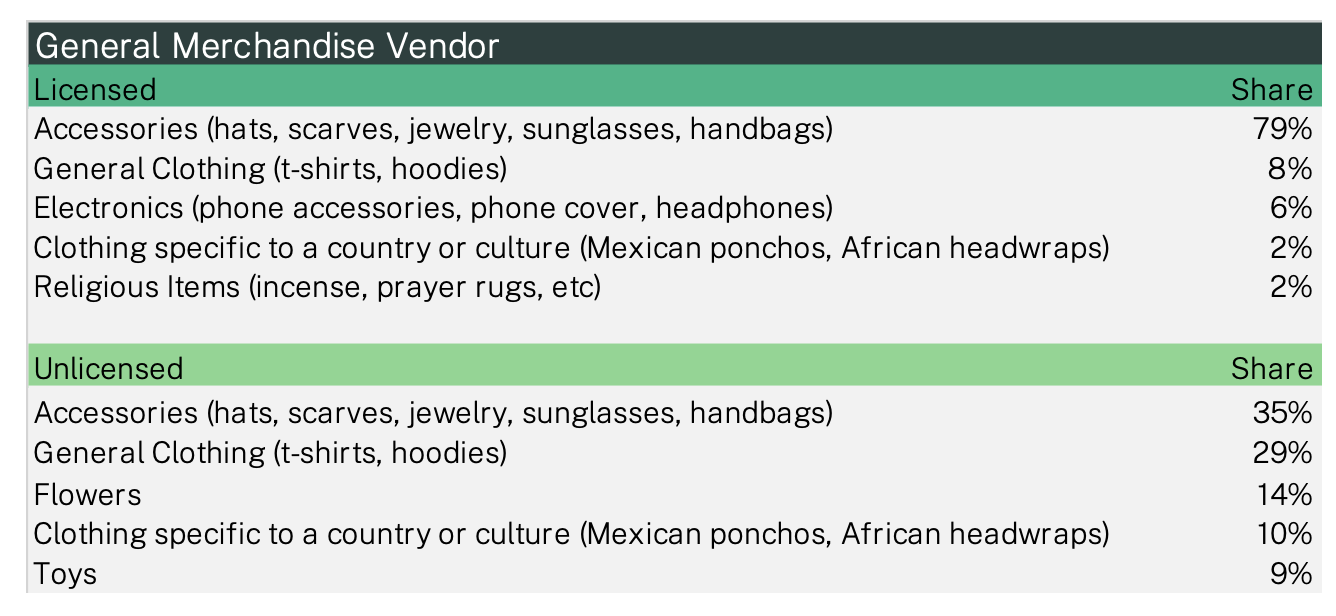
Note: This survey was done when many vendors were temporarily selling personal protective equipment, such as masks. These are excluded from this calculation.
The highest share of merchandise vendors sell accessories such as hats, scarves, jewelry, sunglasses or handbags: this is true for both licensed vendors (79 percent) and unlicensed (35 percent). The next highest category for both licensed and unlicensed vendors is general clothing (8 percent for licensed vendors, 29 percent for unlicensed). The biggest divergence between licensed and unlicensed vendors is that licensed vendors are more likely to sell electronics and religious items, while unlicensed vendors are more likely to sell flowers and toys. Both sell clothing specific to a country or culture.
This survey was done during the height of the COVID-19 pandemic, and many of the vendors, especially unlicensed vendors, were selling personal protective equipment, such as masks, during this time. That is not included in the analysis here since it was very specific to that time. But it is also interesting to note that vendors can be immediately responsive to specific needs that arise.
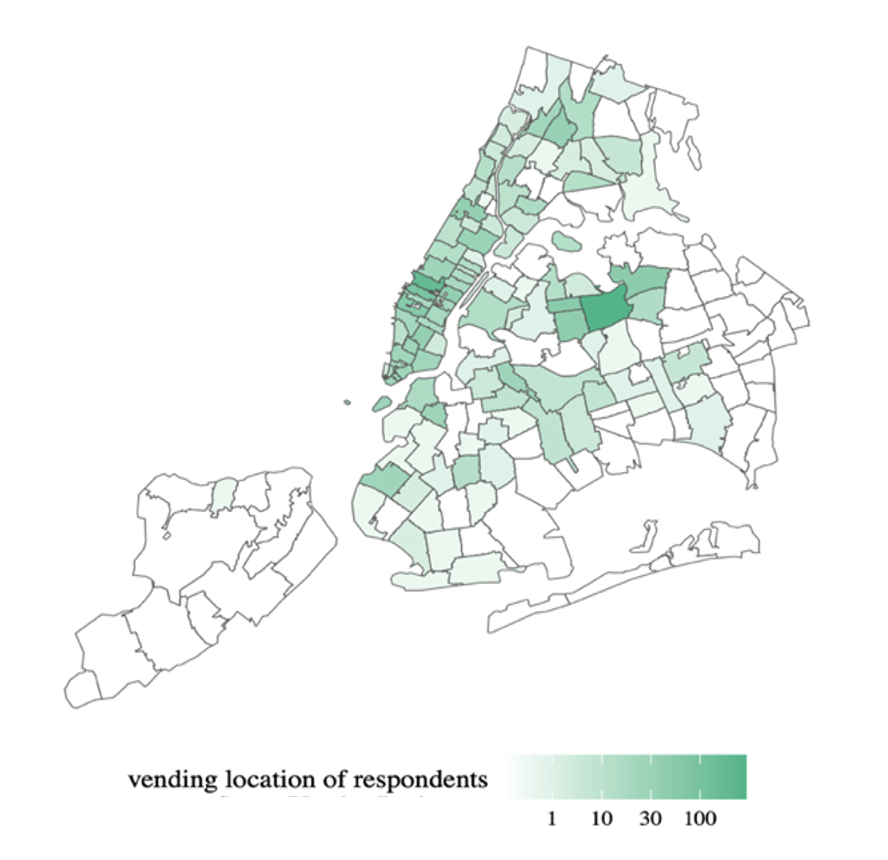
Where Vendors Work
There are vendors doing businesses all across the city, though there are clear areas where street vendors are clustered. Manhattan has the largest share of both mobile food vendors (46 percent) and general merchandise vendors (61 percent). The share is second highest in Queens (33 for mobile food vendors and 23 percent for general merchandise vendors). While there are some vendors located on Staten Island, the sample in this survey is too small for a full analysis. These findings are underscored by Professor Auerbach’s report, which demonstrates that one third of vendors are located in the Queens zip codes: 11368 (16 percent), 11372 (3 percent), and 11354 (3 percent).
Manhattan and Queens Has the Most Vendors
Source: “Estimating the Number of Street Vendors in New York City,” Jonathan Auerbach.
The borough-level analysis gives a broad picture, but a neighborhood-by-neighborhood look gives a more detailed picture. Here, Corona, Jackson Heights and Flushing stand out for their high concentration of mobile food vendors, as does Harlem for general merchandise vendors.
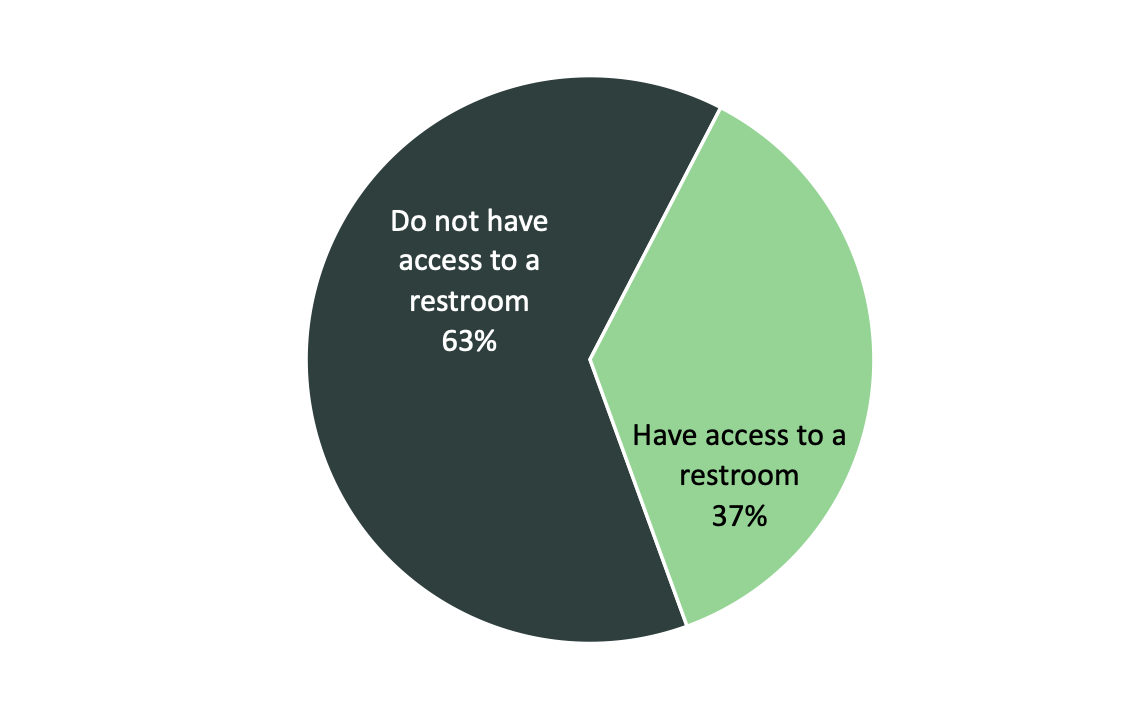
Most Vendors Lack Access to a Restroom
Unlike business owners with storefronts who have physical shelter from conditions like inclement weather and extreme weather events, street vendors, by definition, do not have these protections. Street vendors also lack access to other basic amenities that come with working indoors such as access to restrooms. Overall, 63 percent of vendors lack access to a restroom. This is an issue that stands out especially for mobile food vendors; most general merchandise vendors reported that they do have access to a bathroom.
Nearly Two Thirds of All Vendors Do Not Have Access to a Restroom
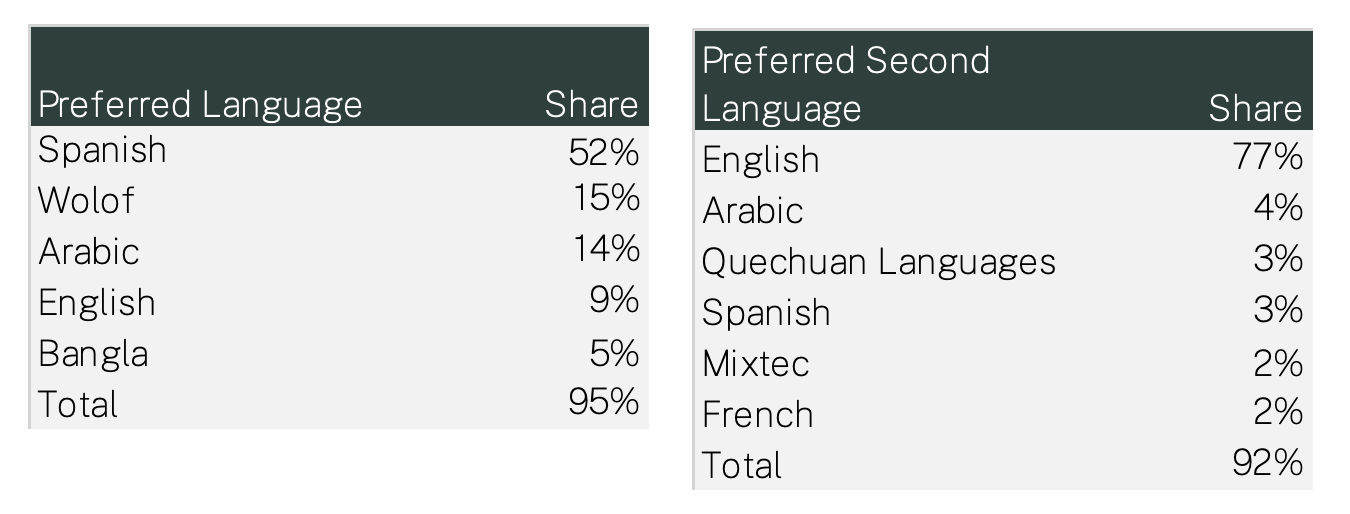
Culture and Language
Nearly all vendors are immigrants, and immigration in New York is extraordinarily diverse. This is also reflected in the extensive number of languages street vendors speak. Over half of vendors (52 percent) list Spanish as their preferred language. The next most common languages are Wolof (15 percent), Arabic (14 percent), English (9 percent), and Bangala (5 percent). While a total of 15 preferred languages were mentioned in the survey, this top five list represents the vast majority, 95 percent, of vendors surveyed.
Perhaps even more striking, a large number, 46 percent, of vendors speak at least two languages, and some speak three or even four.
English is the second language for more than three quarters of the people who report speaking more than one language. But many people speak Arabic as a second language, one of the Quechuan languages, or Spanish, Mixtec, or French.
Spanish, Wolof, Arabic, Bangla: A New York Range of Languages
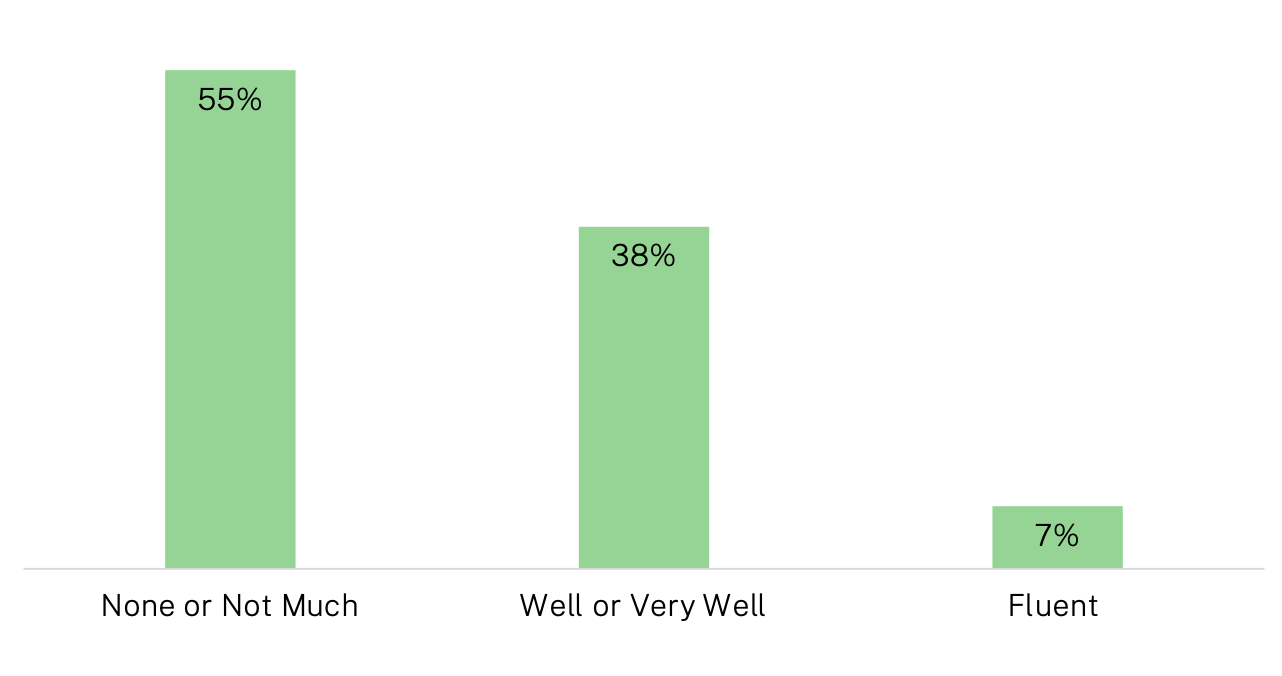
Most Street Vendors Are Not Confident in Their Ability to Speak English
Of the mobile food and general vendors surveyed, the majority, 55 percent, speak little to no English. Less than 10 percent speak English fluently and the remaining 38 percent of vendors speak English well or very well.
Few Vendors Consider Themselves Fluent, But More Than A Third Say They Speak English Well
Vendors Are Small Business Owners
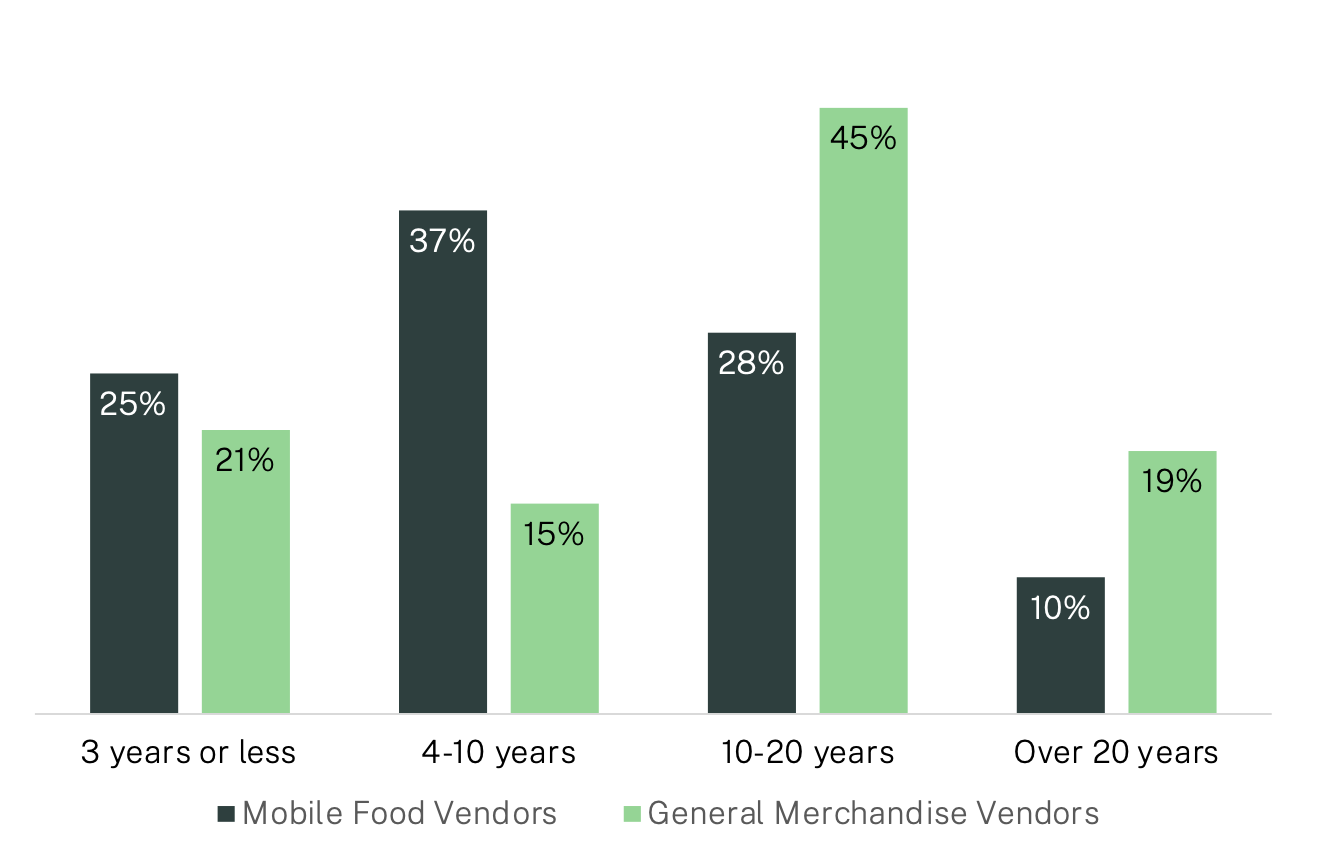
While vending can be part-time work to make additional income for some, for the majority of street vendors it is a longtime profession and primary source of income. Only one in four mobile food vendor survey respondents have been vending for 3 years or less. The remaining three out of four mobile food vendors, 75 percent, have been vending between 4 and 20 years. As shown below, 28 percent have been working at their business for over a decade, and 10 percent for over twenty years.
A similar pattern is also true for general merchandise vendors. Nearly one in five general merchandise vendors has been working as a vendor for over 20 years, 60 percent have been vending between four and 20 years, and the remaining 21 percent of general merchandise vendors have been vending for three years or less.
Most Merchandise and Many Food Vendors Have Been At Their Business Over 10 Years
Vending is The Primary Source of Income for The Vast Majority of Vendors
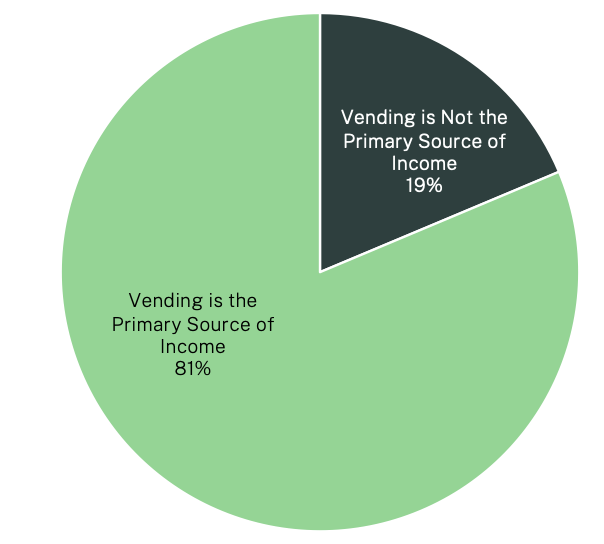
The large majority, 81 percent, of all vendors see vending as their primary source of income.
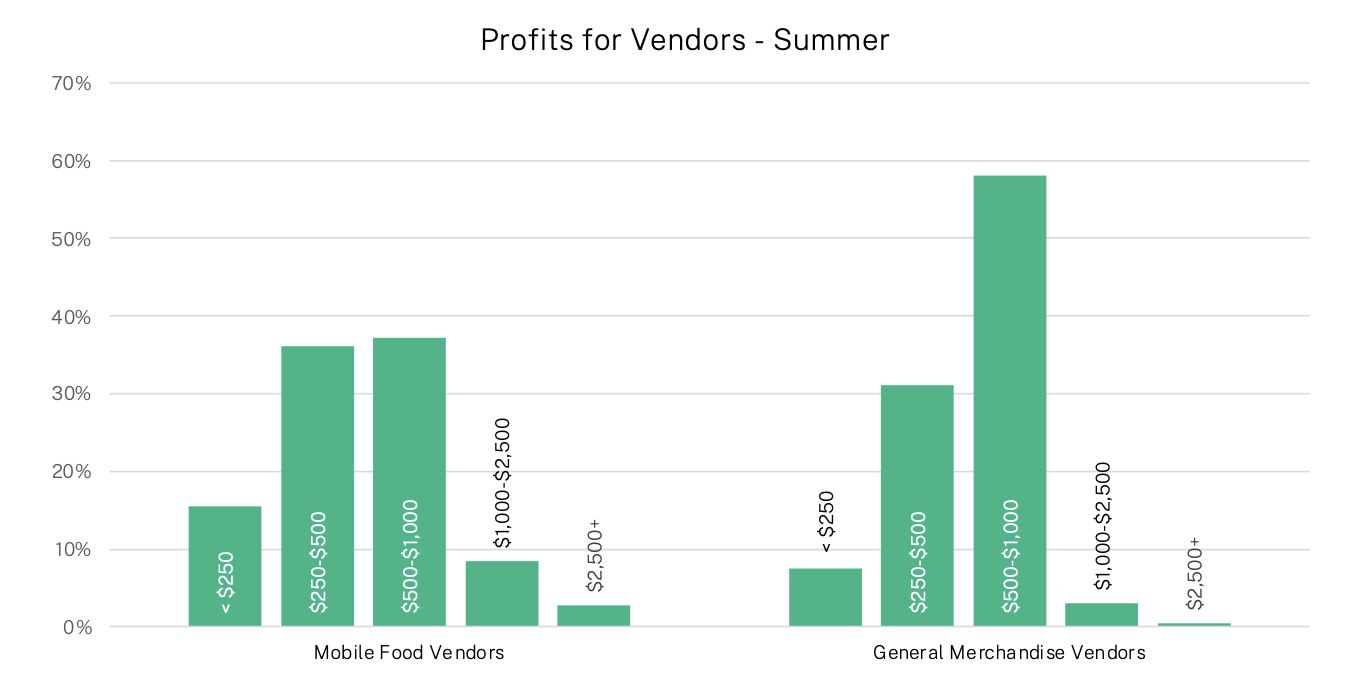
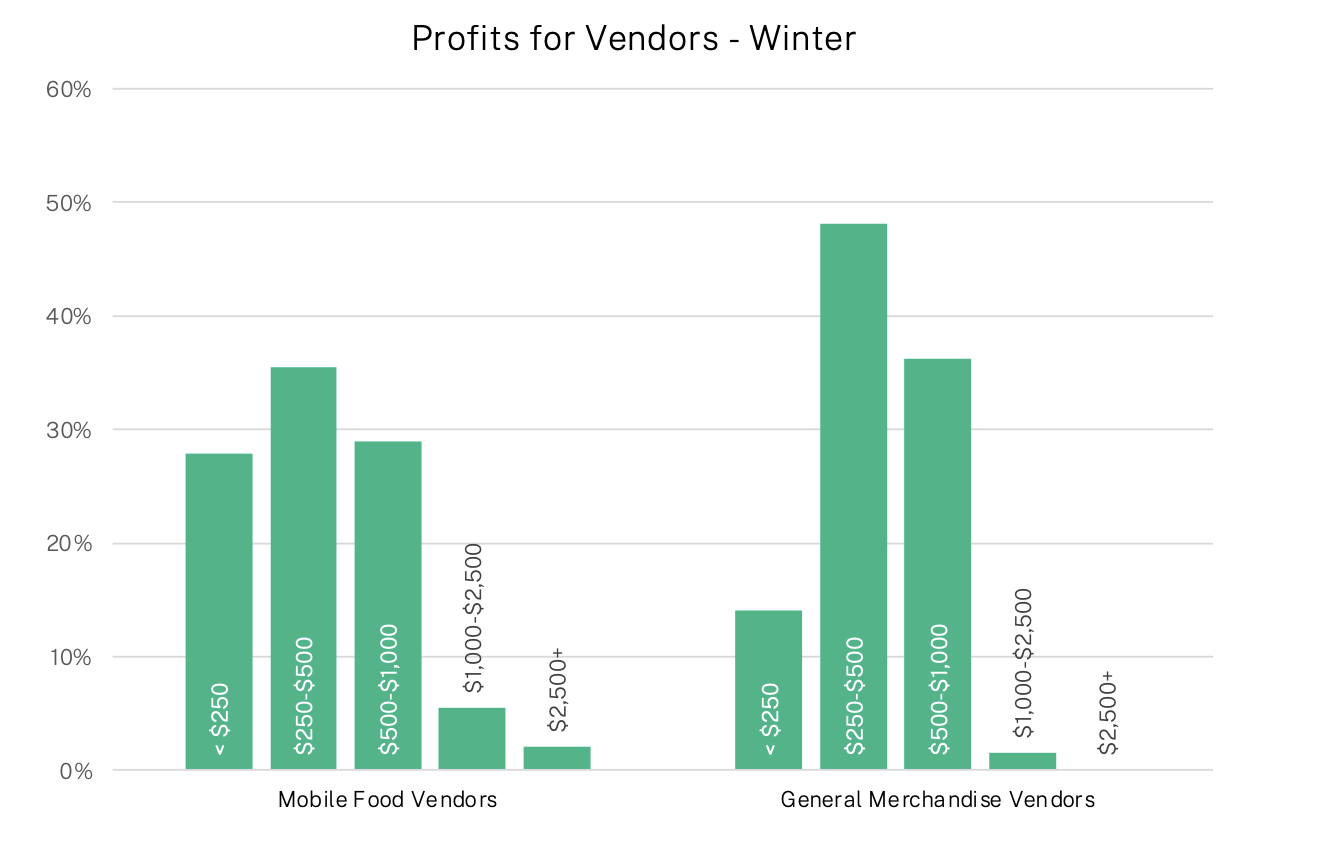
Vendors’ incomes vary significantly depending on the season. Mobile food vendors are somewhat more stable: they are most likely to have profits of between $250 and $1,000 per week in both summer and winter, with more earning under $250 per week in the winter. General merchandise vendors see a significant decline in winter: the majority earn $500 to $1,000 in summer, but by winter most earn under $500.
Vendors may not be able to work full-time and year-round, but to give some sense of what these profit levels mean: a vendor earning $250 per week who works 50 weeks per year would earn $12,500 in profit; an individual making $500/week in profit would make $25,000/year, and an individual making $1,000/week in profit would make $50,000/year.
By comparison, the median annual earnings for New York City residents is $49,000 for all workers, and $67,000 for full-time, year round workers, according to an Immigration Research Initiative analysis of 2022 ACS 5-year data.
During the Covid-19 pandemic, earnings dropped drastically. The survey does not give data for the post-pandemic period, but these pre-pandemic levels give some gauge of likely profit levels today.
Typical Summer Profits for Vendors Range From $250 to $1,o00
Typical Winter Profits for Vendors Range From $250 to $1,o00
Because of government limits, not all working vendors can obtain the permits or licenses necessary to operate formalized businesses.7See the Independent Budget Office report, or also Mahsa Saidi, “Over 10,000 Applicants are Waiting for NYC Street Vendor Permits,” CBS News, June 7, 2024. https://www.cbsnews.com/newyork/news/nyc-street-vendor-permits/ It is clear, though, that operating with these official documents makes a substantial economic difference. For mobile food vendors during the summer, 62 percent of those with a permit show a profit of over $500 per week, compared to 43 percent of those without a permit. During that same season, for general merchandise vendors, 73 percent of those with a license show a profit of over $500, compared to just 36 percent of those who do not have a license.
Having a License/Permit Makes a Huge Difference in Profitability…Or Just Being Able to Get By
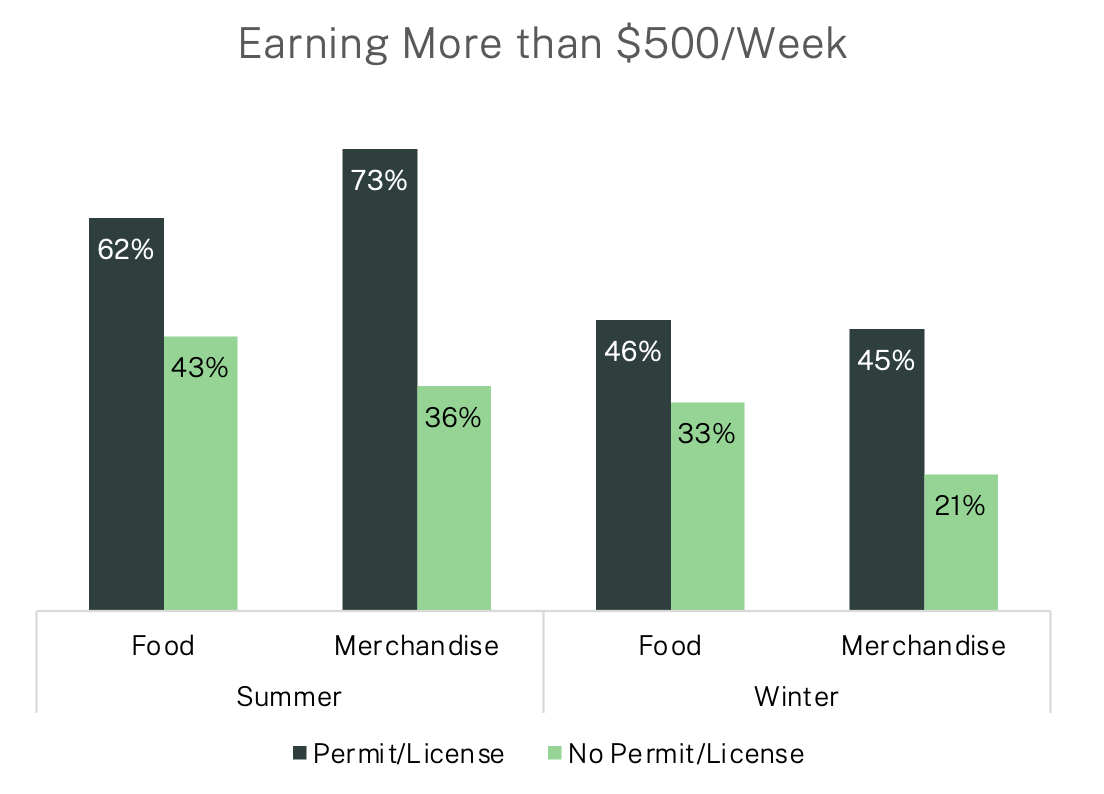
This trend also holds true during the winter months for both mobile food and general merchandise vendors. Having a license or permit is key to achieving higher levels of profitability in this industry. For many vendors who have not had the opportunity to own their own permit or license yet, they dream of one day being able to do so. (See Reflections on Being a Street Vendor Below).
Vendor Home Life
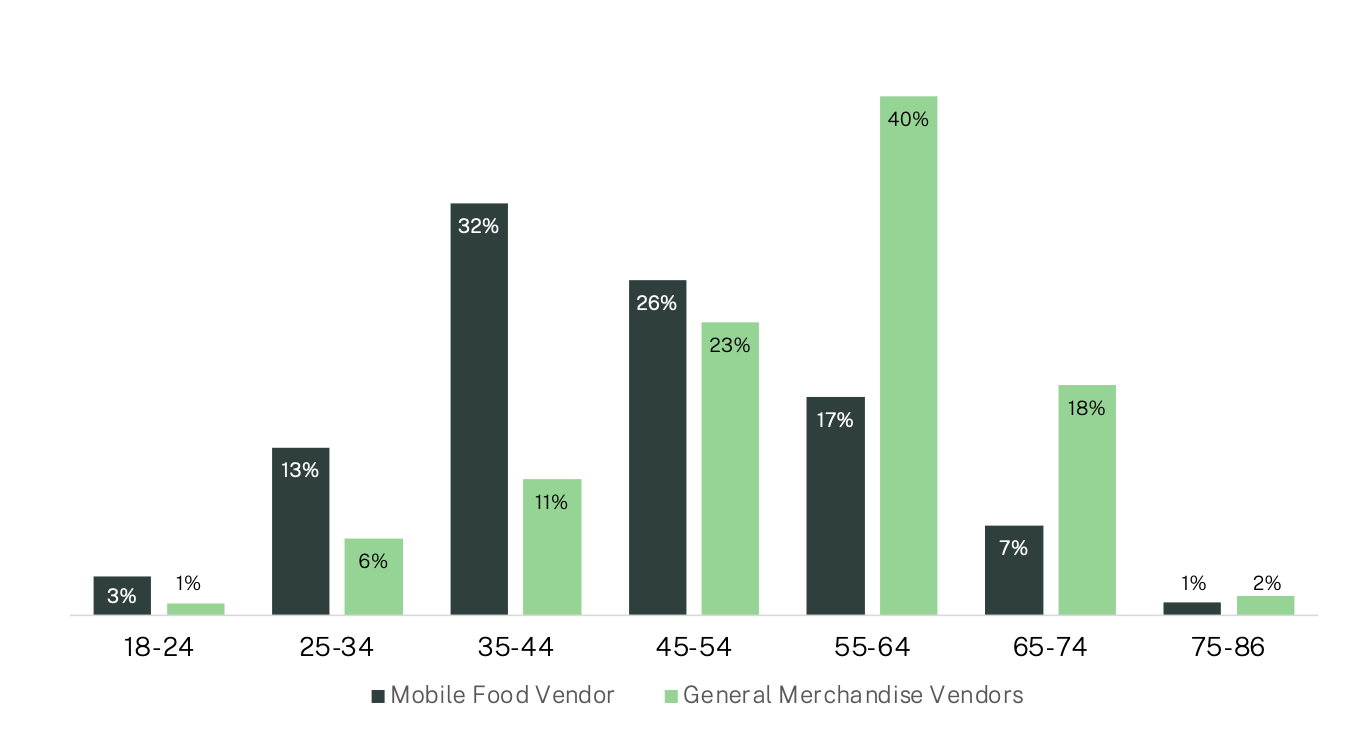
People working as street vendors are represented by nearly every generation: those surveyed ranged from 18 to 86 years old. About a third, 32 percent, of mobile food vendors are between 35 and 44 years old, and 40 percent of general merchandise vendors are 55 to 64 years old. This finding is in sync with the fact that most people surveyed have been vending for over a decade, and for many it is a primary business that supports a family. The average age of mobile food vendors is 45 and the average age of general merchandise vendors is 54.
Food Vendors Tend to Be 35-54 Years Old, Merchandise Vendors 45 to 64 and Above
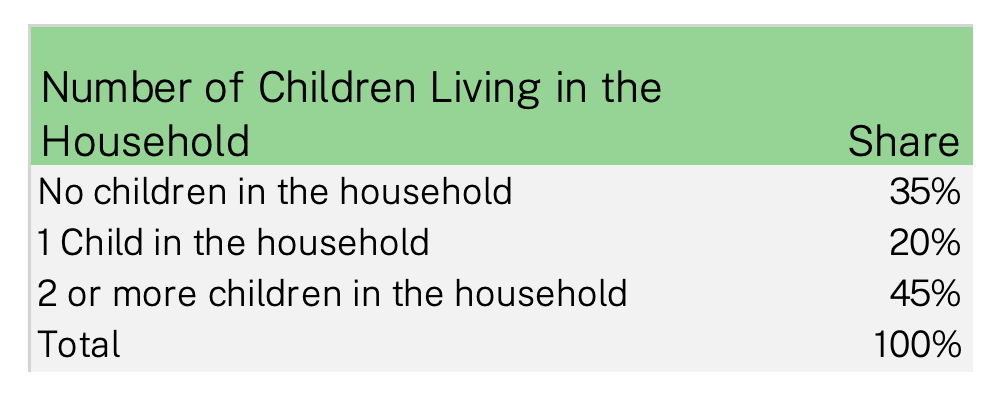
Most street vendors, 65 percent, live in households with one or more children. Only 35 percent of vendors live in households that do not have children.
Most Vendors Live in Households with Children
The borough with the largest diversity of countries represented by its vendors was Queens, reflective of the borough’s status as one of the most globally diverse locations not just in New York but across the globe.8World Economic Forum, Welcome to the Language Capital of the World: Queens, New York, February 2017. Available here: https://www.weforum.org/agenda/2017/02/queens-in-new-york-has-more-languages-than-anywhere-in-the-world/
Vendors Living in Queens Represent the Greatest Range of Countries of Origin
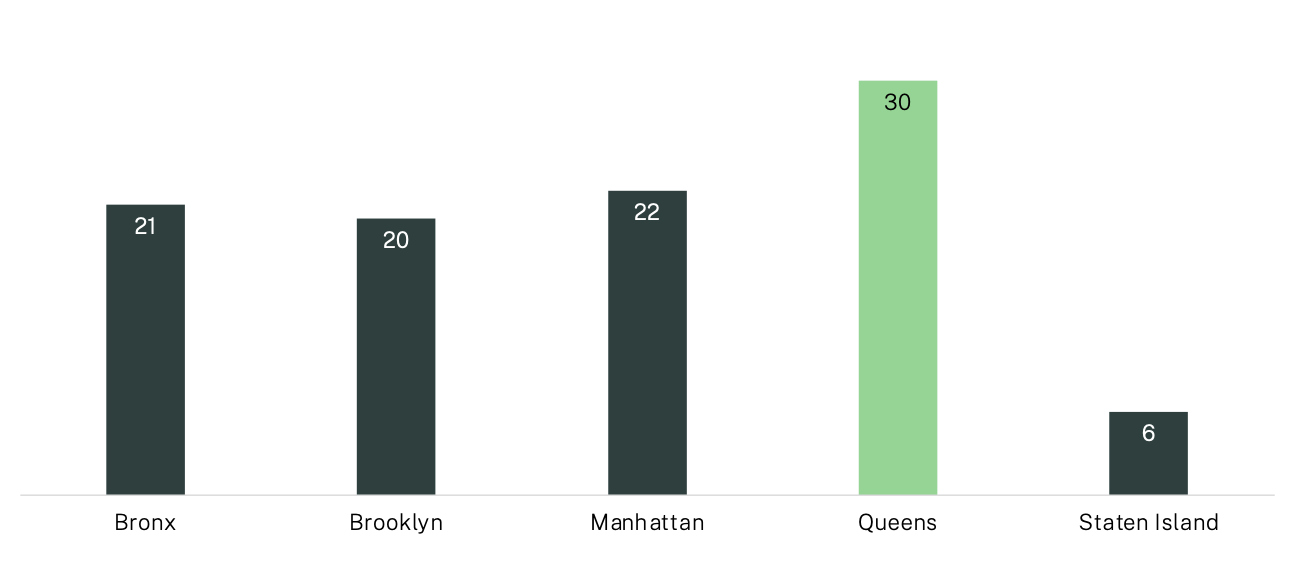
Among those vendors living in New York City, about half of mobile food vendors (53 percent) and a quarter of general merchandise vendors (24 percent) live in Queens, 11 percent of mobile food vendors and 43 percent of general merchandise vendors live in Manhattan, 16 percent of mobile food and 23 percent of general merchandise vendors live in the Bronx, 18 percent of mobile food vendors and 9 percent of general merchandise vendors live in Brooklyn, and 2 percent of mobile food vendors and 1 percent of general merchandise vendors live on Staten Island. See map below.
Residency of Respondents
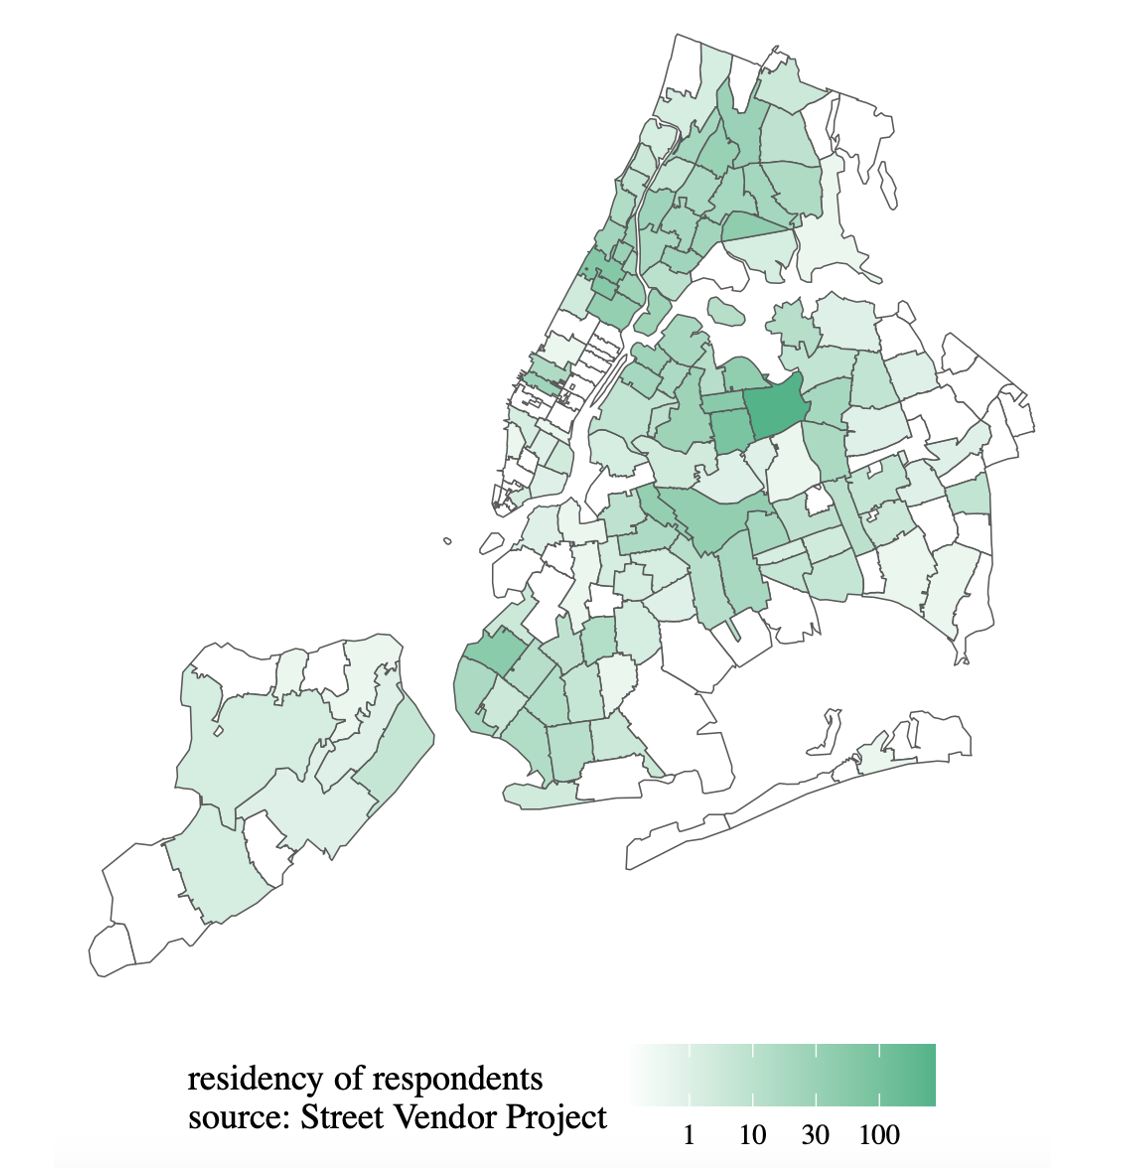
Within each of the five boroughs, the range of countries where street vendors are originally from varied. In Manhattan, the majority of vendors working in the borough were born in Senegal, 55 percent, far outpacing any other country of origin. In Queens the top three countries of origin for vendors who work in the borough is Mexico (22 percent), Ecuador (20 percent), and Egypt (20 percent).
Reflections on Being a Vendor
Open-ended questions asked on the Street Vendor Project’s survey garnered hundreds of unique responses. Many respondents shared that they became street vendors because they enjoy being entrepreneurs saying they did it so “I can be my own boss” and “I can be a small business owner.” Some respondents shared that they had few other options for employment, saying that they became a street vendor “because I could not find another job” and “I became a vendor because I had no job and no social security and not being able to talk English.” Other respondents shared simple reasons why they became street vendors such as “Because I love the job,” and because being a street vendor is a “flexible job.” As the data from this survey has shown, 96 percent of street vendors were born abroad and shared that they became street vendors “because when I came to this country, this was my first my job.”
Another open-ended question asked was, “Why did you remain a vendor?” As shown above, street vending is not just a seasonal or transitional job but a long-term career for most. Over the past five years street vendors have overcome a global pandemic, extreme weather events, and challenging policing however they have remained dedicated to their small businesses and have provided New Yorkers with a diversity of flavors and fabrics. Of the hundreds of reasons given for why they have remained dedicated to their businesses many vendors shared that being a vendor “allows time with my kids,” is their “only source of income”, “is the only job I can do,”and is “all I have ever known.” Another theme that came up was that there were few other options to earn a living outside of vending. Some respondents have continued vending because they are “older and have no education to do something else” or due to their “age” and “immigration status.” Others responded that they have chosen to remain a vendor because “I like being my own boss and like to interact with the customers” and simply, “because I like it.”
Do you like being a vendor?
The business is tough, early mornings and late nights, difficulty finding restrooms, little protections from seasonal weather events, no benefits like paid leave, holidays, or health care, harassment by police, and the ever-constant vulnerability of working on the streets of New York. However, despite these challenges, this survey revealed that 95 percent of street vendors reported enjoying being a vendor.
Dreams for the future of their business
Top 5 Responses Represent Aspirations for 93 Percent of Vendors
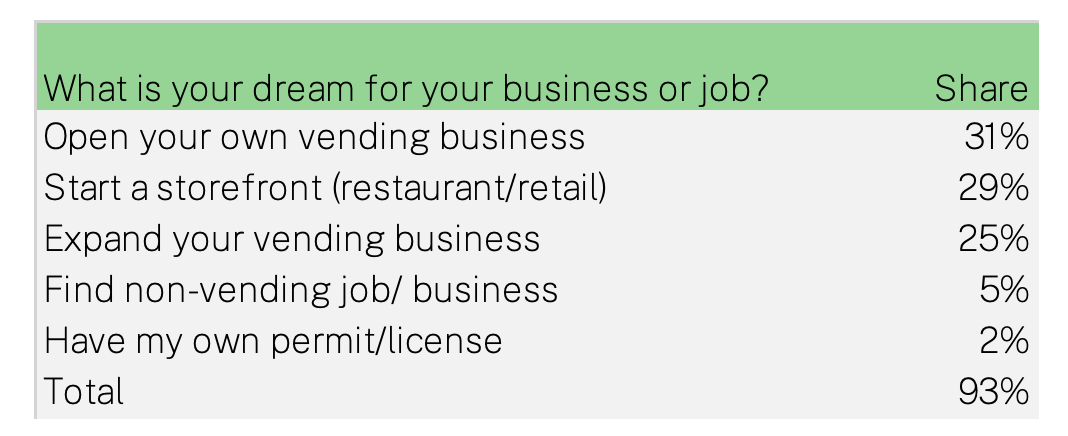
The vendors surveyed also shared their future business goals. These responses show aspirations to move from being an employee to a business owner, with 31 percent of respondents sharing that they would like to open their own vending business. Twenty-nine percent of vendors dream of starting a storefront business, and 1 in every 4 vendors surveyed would like to expand their business by getting bigger or more carts/trucks to sell their products from. Only 5 percent of vendors surveyed responded that they dream of finding a non-vending job/business. The overwhelming majority of vendors enjoy their work and dream of a future where they can enjoy more success and expand their business. There are also vendors who dream of being able to operate their businesses with the proper permit and licenses required. The fifth most common response of all vendors surveyed was some variation of wanting to own a permit or the opportunity to get a license. For many, this would alleviate the burden of renting permits which would be a profound impact to their business and livelihoods.
Vendors Who are U.S. Military Veterans
Vendors who are U.S. military veterans are faced with a different set of circumstances and regulations than other vendors, so this report considers them separately from the analysis of other vendors. Veterans are not subject to the cap on licenses for general merchandise vendors, for example, and veterans who are disabled can get permits for mobile food vending outside city parks. There are 1,069 veterans of the U.S. military with active licenses as general vendors, according to a recent report from the Independent Budget Office, as well as a smaller number with food vendor permits.9Fiscal Impact of Eliminating Street Vendor Permit Caps in New York City, p. 4.
The Street Vendor Project survey gives some key insights into veterans who work as street vendors.
Vendors Who Are Military Veterans Are Mostly U.S.-Born

The majority of veterans who are vendors were born in the United States—70 percent overall, including seven percent who were born in Puerto Rico.
A significant majority, however, are U.S. military veterans who were born in other countries: Senegal, Guatemala, Ecuador, Bangladesh, Ghana, China, and many other countries.
The Large Majority Are Men

The large majority of vendors who are military veterans identify as men—87 percent of the total. Women are also military veterans, and also become street vendors, but not to nearly the same degree.
Veterans Who Are Vendors are Mostly Black or Latinx
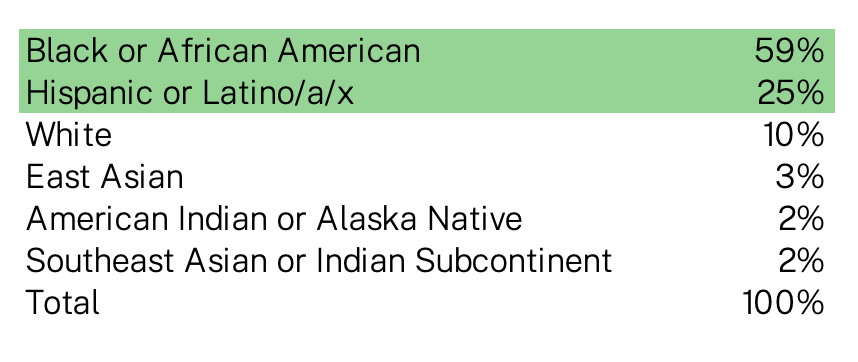
The majority of veterans who are vendors identify primarily as Black or African American—59 percent of the total. Another 25 percent identify as Latinx, and 10 percent identify as white.
Most Veterans Are General Merchandise Vendors

Two thirds of vendors who are veterans sell general merchandise, and almost all of the remaining third are mobile food vendors. A few also work as 1st Amendment Vendors, selling artwork or political buttons, for example.
Most Vendors Who are Veterans Have Been Selling for 15 years or More
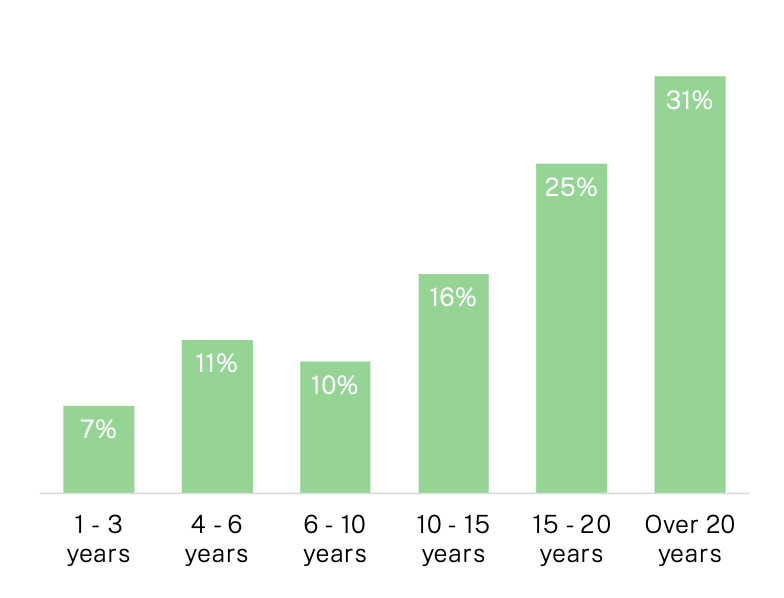
Every year there are some veterans who are new to vending. Seven percent have been vending for three years or less. But the majority of veterans who are vendors have been at the job for 15 years or more. Fully 56 percent have been selling for 15 years or more, including 25 percent selling for 15 to 20 years, and 31 percent selling for over 20 years.
Conclusion
The street vendors of New York are an exceptionally diverse group of entrepreneurs that have settled in New York from every corner of the world. Their small businesses offer goods and foods that are fast, convenient, and affordable. New Yorkers and visitors alike cherish the offerings of fashions and flavors that are typical of New York and from around the world.
Before this survey was undertaken much about these business owners was unknown. We now have an empirically grounded, large-scale survey that gives detailed insight into who vendors are and how they work and live.
This incredible diversity is a testament to the economic opportunity that this industry offers to immigrants and the City of New York that provides the setting for these communities as they establish roots and settle in America, and in the process add to the street life of the city.
Principal Author: Shamier Settle, Senior Policy Analyst, Immigration Research Initiative.
Contributors: David Dyssegaard Kallick, Director, Immigration Research Initiative
Carina Kaufman-Gutierrez, Deputy Director, Street Vendor Project
Mohamed Attia, Managing Director, Street Vendor Project
Jonathan Auerbach, Assistant Professor, Department of Statistics, George Mason University
Methodology
This analysis was conducted in three parts: survey data collection by the Street Vendor Project, construction of statistical weights by Jonathan Auerbach so that the survey data reflect the population of street vendors in New York City, and analysis of the characteristics of street vendors, and writing of the report, by Immigration Research Initiative.
In 2021, the Street Vendor Project conducted a large-scale survey of vendors. The survey was administered in English, Spanish, Bangla, Wolof, Arabic, Mandarin, French, Cantonese, and Tibetan from January 2021 through November 2021, while distributing Coronavirus relief aid in 2021. The aid, provided by Robin Hood and Morgan Stanley, was a one-time payment of $1,000, available to any individual who owned, operated, or was otherwise employed by a street vending business in New York City between 2020 and 2021, including food, merchandise and first amendment vendors. There were no limits based on the size of the business, the number of sales, whether licensed and/or permitted, and there was no requirement to be a member of the Street Vendor Project. All individuals eligible for aid were invited to complete a survey. SVP found aid-eligible individuals through membership lists, referrals, and canvassing operations in which SVP affiliates visited neighborhoods.
The survey was undertaken during the height of the COVID-19 pandemic and included both vendors who were actively vending and those who were not vending during that time. It includes both members of the Street Vendor Project and non-members, different types of vendors, and different geographic areas. This survey is broadly representative. The Street Vendor Project made substantial efforts to get aid to as many vendors as possible and trust in the project made it possible to break through many barriers that might make surveying this population challenging.
SVP then turned the raw data over to Immigration Research Initiative for an independent analysis. The first step of this analysis involved working with Professor Auerbach, who combined the survey data collected with administrative data in New York City government records to construct statistical weights and estimate the total number of street vendors in New York City. Since the survey includes questions about whether or not vendors have a license or permit, and New York City government counts how many people have licenses or permits, Professor Auerbach used ratio estimation, a common statistical technique, to project how many vendors there are in total. Details of Professor Auerbach’s analysis are available in a research paper, “Estimating the Number of Street Vendors in New York City.” 10Jonathan Auerbach, “Estimating the Number of Street Vendors in New York City.”
Immigration Research Initiative used the same data set to analyze the characteristics of vendors. Where mobile food vendors and general merchandise vendors are combined, the statistical weights developed by Professor Auerbach were used to combine the two groups and give an overall number. In addition to the work with Professor Auerbach, the overall project benefitted from the significant input of Debipriya Chatterjee, senior economist, and Irene Lew, former analyst, at the Community Service Society.
The survey was undertaken during the height of the covid pandemic and included both vendors who were actively vending and those who were not vending during that time. It includes both members of the Street Vendor Project and non-members, different types of vendors, and different geographic areas. This survey is broadly representative. The Street Vendor Project made substantial efforts to get aid to as many vendors as possible, and trust in the project made it possible to break through many barriers that might make surveying this population challenging.
- 1Dick M. Carpenter II, Upwardly Mobile: Street Vending and the American Dream, Institute for Justice, October 6, 2015, https://ij.org/report/upwardly-mobile/
- 2Previous analyses of street vendors and their economic impact in New York City include “Fiscal Impact of Eliminating Street Vendor Permit Caps in New York City,” by the New York City Independent Budget Office, available at https://ibo.nyc.ny.us/iboreports/Fiscal_Impact_of_Eliminating_Street_Vendor_Permit_Caps_Jan2024.pdf. And, for a more national overview, “Upwardly Mobile,” by Dick M. Carpenter II, published by the Institute for Justice, https://ij.org/wp-content/uploads/2015/10/upwardly-mobile-web-final.pdf “Upwardly Mobile” references about 17,000 vendors and people who work for vendors in New York City in 2016, an estimate based primarily on interviews and rough extrapolation from New York City data sources. The Independent Budget Office report writes “Though the number of street vendors in the City is unknown, some estimates suggest the total number of active vendors in the City may near or exceed 20,000.”
- 3Jonathan Auerbach, “Estimating the Number of Street Vendors in New York City,” available at https://jauerbach.github.io/research/auerbach_vendor_2024.pdf.
- 4For discussions of the barriers to entry for street vending, other than licensing or permitting, see Lacey Sigmon, “Advocating for Equitable Street Vending Policies,” Progressive City, or Joseph Pileri, “Who Gets to Make a Living? Street Vending in America,”Georgetown Immigration Law Journal, 2021, volume 1.
- 5See Frank Lombardi, “Vendors Signed on Bill to Ban Immig Probe,”New York Daily News, July 12 2005, https://www.nydailynews.com/2005/07/12/vendors-sold-on-bloomberg-signs-bill-to-ban-immig-probe/
- 6For more on the role of women in street vending, and the added challenges they face, see “Vulnerable in Itself: Results and Recommendations from a Study of Women Street Vendors in New York City, October 2019, Urban Justice Center, https://www.scribd.com/document/432317126/Vulnerable-in-Itself.
- 7See the Independent Budget Office report, or also Mahsa Saidi, “Over 10,000 Applicants are Waiting for NYC Street Vendor Permits,” CBS News, June 7, 2024. https://www.cbsnews.com/newyork/news/nyc-street-vendor-permits/
- 8World Economic Forum, Welcome to the Language Capital of the World: Queens, New York, February 2017. Available here: https://www.weforum.org/agenda/2017/02/queens-in-new-york-has-more-languages-than-anywhere-in-the-world/
- 9Fiscal Impact of Eliminating Street Vendor Permit Caps in New York City, p. 4.
- 10Jonathan Auerbach, “Estimating the Number of Street Vendors in New York City.”