Who Is ICE Arresting?
The Trump administration has radically expanded and changed the nature of immigration enforcement in the United States in the last six months. At the forefront of the push for increased immigration enforcement are misleading claims by the administration that it will focus on arresting and deporting people who have been convicted of crimes. As a recent Los Angeles Times headline put it, “Trump Says He Wants to Deport ‘The Worst of the Worst.’ Government Data Tell Another story.”
Newly released data on ICE arrests to show that, in fact, as immigration enforcement increases, the percent of those arrested who are convicted of a crime decreases.
ICE arrests increased immediately when President Trump took office in 2025, and then stepped up even further around May when ICE introduced a quota for officers to attempt to arrest 3,000 people per day. In both cases, as arrests increased the percent of those arrested with a criminal conviction fell. Most of the people ICE is arresting today do not have a criminal conviction.
To better identify how enforcement has been evolving, we explore newly available data on ICE arrests through June 26, 2025. Other researchers and organizations are also analyzing this data, and we add to this by showing the stark negative relationship between recent increases in arrests and the percent of those arrested that are convicted of a crime. Additionally, we explore the methods of arrest that ICE is using and where in the US these arrests are taking place and how this contributes to the overall national trends in arrests.
1. ICE arrests spike in January and May of 2025, and every time arrests increase, the percentage of those arrested who are convicted of a crime falls
In the year leading up to Donald Trump’s second inauguration, the average daily number of ICE arrests was stable at about 200 a day. That number roughly tripled, to around 600 per day, immediately after January 21, 2025. Arrests continued steadily at this heightened rate until May 2025.
Beginning in May, arrests rose to about 1,000 per day. This coincides with when ICE introduced a new quota to target 3,000 arrests per day. Despite aggressive actions, ICE has not yet reached the target of 3,000 per day, and in fact the number of people ICE has been able to arrest decreased some—it was at about 800 per day before the end of June. (See Figure 1: The moving average experiences regular dips when more weekend days are included in the average because ICE arrests fewer people on weekends compared to weekdays.)
AS THE NUMBER OF ICE ARRESTS GOES UP, THE PERCENT WHO ARE CONVICTED OF A CRIME GOES DOWN
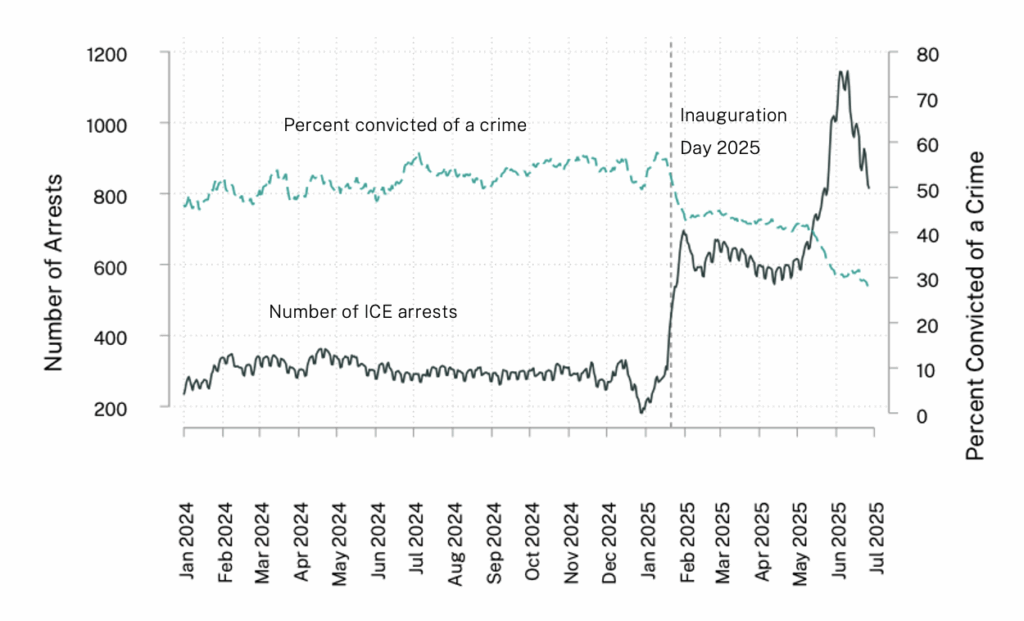
Fig 1. ICE arrest data obtained from the Deportation Data Project, where total arrests are aggregated by date. Chart reports a 15-day moving average of the daily totals. The percentage of individuals convicted of a crime is calculated as the proportion of arrested individuals who have been convicted of a crime, divided by the total number of arrests that day. Individuals with pending charges are not counted to be convicted of a crime. The percent of arrests that are convicted is also calculated as a 15-day moving average.
Both times the number of daily arrests increased—in January and May—there was a decrease in the percentage of people ICE arrested who had been convicted of a crime. (Importantly, violations of immigration laws are civil, not criminal violations.) The fact that the percentage of arrests that are people with a history of criminal convictions is falling is consistent with other research as well, such as that done by Austin Kocher and the New York Times.
Furthermore, ICE often designates individuals with dismissed criminal charges or pending charges as “convicted.” For this reason, it is likely that this is an overestimate of the number of people with an actual criminal history that are being targeted and arrested due to increased immigration enforcement. Additionally, some of the people arrested by ICE are eventually released because in fact they fully followed civil immigration law in addition to not having a criminal record.
The fact that arrests and the percentage with criminal convictions move in opposite directions is directly contradictory to claims made by Trump’s immigration policy supporters that only the “dangerous criminals” are being affected.
2. ICE increasingly arrests people through methods that do not target those with a criminal conviction
Prior to the inauguration, about half of arrests were done through the Criminal Alien Program (CAP) program and the rest were done through a mix of other methods. Beginning in January 2025, there is a noticeable increase in arrests through CAP, but also an increasing usage of Non-Custodial arrests and Located methods.
The main source of ICE arrests has been, and remains, the Criminal Alien Program (CAP). This allows ICE agents to visit and screen whether inmates in incarceration facilities are removable. These operations can occur at federal, state, and local incarceration facilities, but by far the primary source of ICE arrests is from local incarceration, where the rate of people with convictions is lowest of the three. The number of immigrants ICE arrested from local incarceration under CAP has more than doubled since President Trump took office. 42 percent of immigrants arrested by ICE under CAP from local incarceration have a criminal conviction. (Data about rates of convictions comes from the Deportation Data Project, using information from January to June 2025.)
Located Arrests have stepped up very significantly, yet just 33 percent of immigrants ICE arrests in this way have a criminal conviction. Located Arrests are not particularly well documented or understood, but they can refer to a wide range of arrests that can’t be classified under CAP or another category.
And, Non-Custodial Arrests have also stepped up to be the third-largest source of ICE arrests. Non-custodial arrests refer to actions against individuals not in custody of another agency and arrests that do not result in detention. Among immigrants arrested by ICE in this way, 26 percent have a criminal conviction.
Other ways ICE arrests people account for a small share of the number of immigrants being arrested. These include CAP State Incarceration (91 percent with criminal convictions), Probation and Parole (91 percent), CAP Federal Incarceration (85 percent), the 287(g) Program (53 percent), Worksite Raids (13 percent), and ERO Reprocessed Arrest (27 percent).
The most recent increases in arrests are driven by Non-Custodial arrests and Located, but not CAP. Specifically, the spike in total arrests around May and June seems to be largely driven by changes in Non-Custodial and Located arrests. These two apprehension methods increased significantly in early June, and decreased slightly towards the end of the month, while other sources of arrests, including CAP, have remained fairly level. This could indicate that while ICE was initially able to boost its arrests through CAP, this channel was not sufficient to meet the arrest quotas set in May 2025. Alternatively, under the pressure to meet the required 3,000 arrest per day, this might be indicative of ICE turning to enforcement channels that require fewer resources to operate.
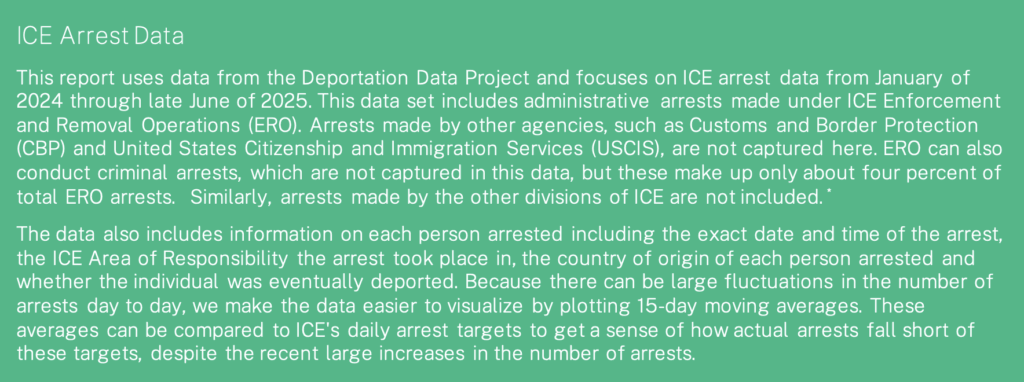
Increases Driven By FIrst CAP Local InCarceration, Then Located and Non-Custodial Arrests
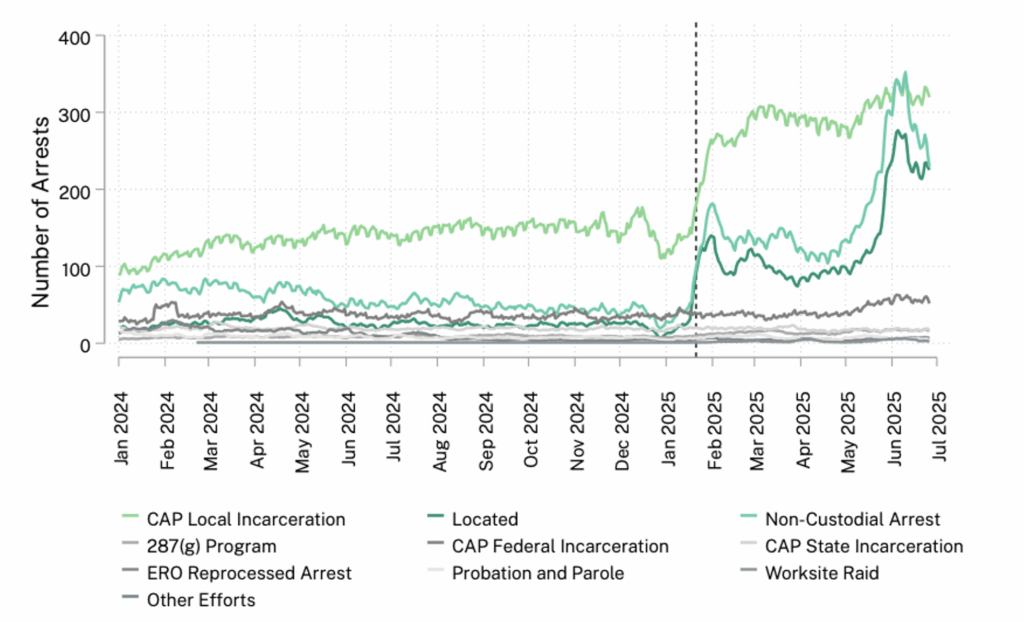
Fig. 2. ICE arrest data obtained from the Deportation Data Project where total arrests are aggregated by date. Reports a 15-day moving average of the daily totals centered on the first of the month. Totals are additionally split by the reported method of apprehension listed in the data. Other efforts include anti-smuggling, boat patrol, crewman/stowaway, criminal alien program, inspections, law enforcement agency response unit, organized crime drug enforcement task force, other agency, other task force, patrol border, patrol interior, traffic check, transportation check bus, transportation check aircraft, transportation check passenger train.
This aligns with many media reports of ICE activity in the second Trump administration. For example, there have been many arrests of individuals legally seeking asylum and some simply going to work in Denver. In Chicago a man with no criminal conviction was arrested without a warrant while running family errands.1 By law, ICE arrests do require an administrative warrant. There are only two exceptions in which a warrant is not required: “1. the alien, in the presence or view of the immigration officer, is entering or attempting to enter the United States unlawfully; or 2. the immigration officer has “reason to believe” that the alien is in the United States unlawfully and is likely to escape before a warrant can be obtained.” Several men were arrested in Miami while attending immigration proceedings and similar events occurred in Sacramento.
3. Some geographic areas are experiencing more arrests and greater increases in arrests than others
ICE Enforcement and Removal Operations can be divided into areas of responsibility (AORs), which are geographic boundaries under which enforcement activities take place under the same office of operations. The size of these areas varies, with some comprising of several states and others including only a select few counties within a state. To illustrate these boundaries and how arrests have differently changed across locations, we show the percent change in arrests by AOR before and after Trump took office in Figure 3.2To be exact, we calculate the total number of arrests by AOR in the 156 days before the inauguration and compare that to the 156 days of information we have after the inauguration. Areas with the largest changes are shaded darker and those with the smallest are white. The areas with the largest change in arrests relative to the pre-Trump average arrest are Miami, Atlanta, Boston, San Diego and Denver AORs. We refer to these AORs based on where the largest field office within the AOR is located, following ICE’s own terminology. The largest increase was 292 percent in Boston and the second highest was a 289 percent increase in San Diego.
ICE APPREHENSIONS AND INCREASES ARE CONCENTRATED IN A HANDFUL OF AREAS SO FAR
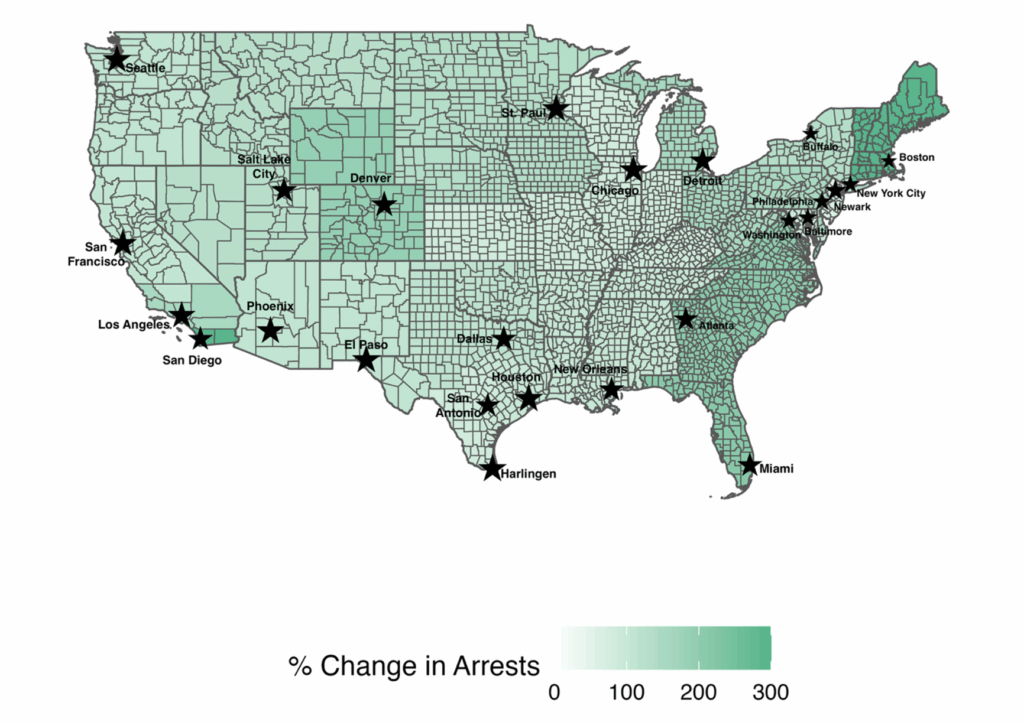
Fig. 3. Area of Responsibility boundaries are from ICE ERO. The percent change is calculated as the difference between the average arrests in the 156 days before January 21, 2025 and 156 days after, divided by the average over the 156 days before. Uses ICE arrests data obtained from the Deportation Data Project from September 2024 to June 2025.
Three patterns emerge when looking at arrests by area and method of apprehension. 1) Areas that saw large, immediate spikes in arrests after President Trump took office appear to be driven by pre-existing CAP programs. 2) There are smaller, more isolated spikes in Non-Custodial arrests after January, mostly driven by the new city-wide raids that ICE has been conducting. And 3) there are smaller and isolated increases in Located arrests, which don’t follow patterns of other regular ICE activity and appear to be concentrated in areas with protests.
The areas that experienced immediate and large increases in arrests, appear to be places participating in CAP before the second Trump administration. These areas include Atlanta, Chicago, Dallas, Houston, Miami, and New Orleans. CAP arrests quickly level out after the initial increase in these areas in January and February 2025. These types of arrests did not seem to respond to the higher quota introduced in May 2025.
In addition, smaller, isolated, and short-lived spikes that appear to be driven by city-wide raid activity. (See Figure 4.) Arrests resulting from raids mostly manifest in the data as Non-Custodial arrests, which are most likely to result in the arrest of individuals with only immigration violations. For instance, looking at the Denver AOR, there is a noticeable spike around the end of January, when there was a large increase in ICE activity all around the city of Denver. Other AORs show similar spikes when reported city-wide ICE activity took place, such as on March 18, 2025 when arrests more than quadrupled in Boston during the several-day long series of ICE raids in the cityand in New York City on April 16th during an ICE operation resulting in the apprehension of over 200 people.
While these data have already been independently verified by comparing total monthly arrests compared to previously published OHSS (Office of Homeland Security Statistics) numbers, the fact that these city-wide raids reported in the media is observable in this data adds credibility to these findings.
Turning to the Los Angeles AOR, a third and distinct arrest pattern emerges. Rather than arrests seeming to be driven by CAP or Non-Custodial arrests, Los Angeles AOR sees a large and dramatic increase in Located arrests starting in May of 2025. This spike in arrests was right before the large protests of ICE activity in Los Angeles. Although Los Angeles is the most extreme example of this, these types of arrests seem to be occurring elsewhere. For instance, the Miami AOR also experienced a large and late spike in Located arrests, precipitating recent protests in Miami. San Diego also appears to see an increase in Located arrests surrounding protest activities. The fact that these arrests have a different method of apprehension compared to the Non-Custodial arrests typical of new city-wide raids, seems to signify that these are not a result of ICE’s typical enforcement activities. And, these arrests are unlikely to result in the arrest of individuals with a criminal conviction.
ICE ARREST SPIKES: ATLANTA, BOSTON, CHICAGO, DALLAS, HOUSTON, LOS ANGELES, MIAMI, NEW ORLEANS AND SAN ANTONIO AND SAN DIEGO
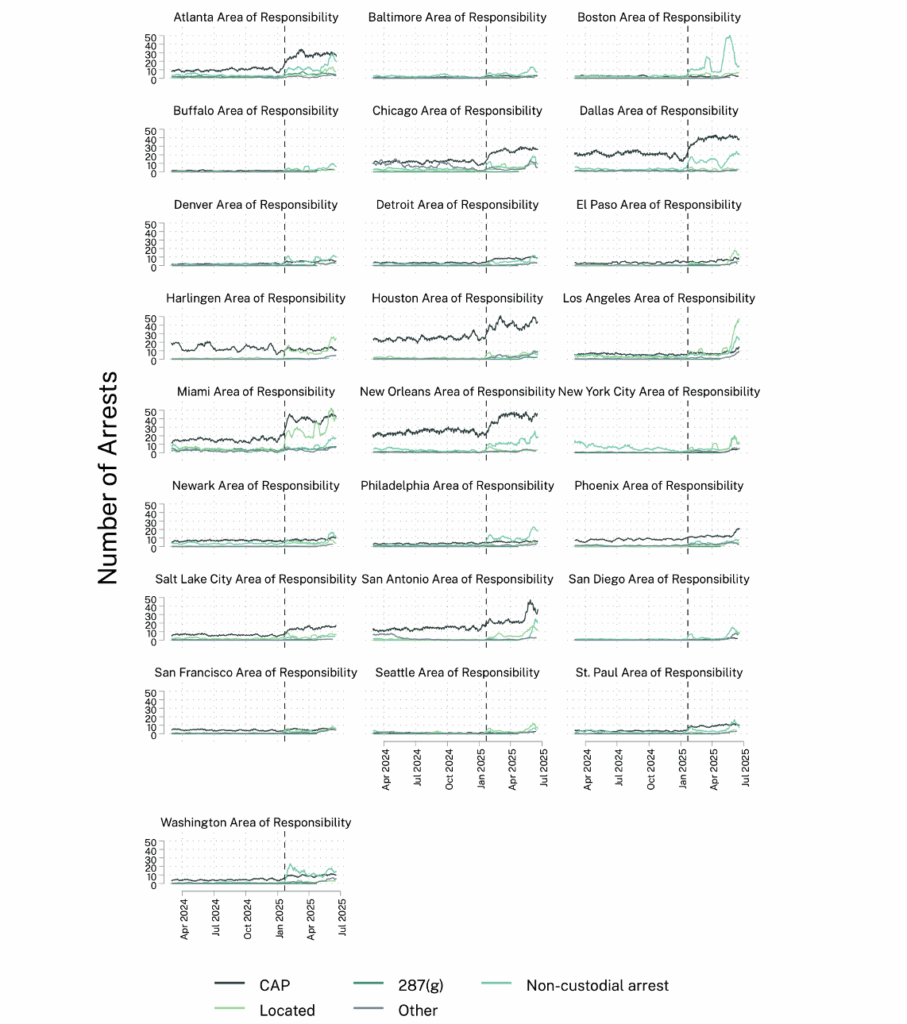
Fig. 4. Uses ICE arrest data obtained from the Deportation Data Project where total arrests are aggregated by date. Reports a 15-day moving average of the daily totals. Totals are additionally split by the reported method of apprehension listed in the data. CAP includes Federal, State, and Local CAP apprehensions and other includes ERO reprocessed arrests, located, probation and parole, worksite enforcement, and all other efforts.
Conclusion
These results have several implications. As many others have documented, ICE arrests have skyrocketed since Trump took office in January. While daily arrests remain well below even January’s targets of 1,200 to 1,500 arrests per day, this still represents a 141 percent increase compared to before Trump’s inauguration with some areas experiencing over a 200 percent increase in average arrest levels. With the increase in ICE’s budget from the recently passed reconciliation bill, there is discussion of a new quota for an extraordinary 7,000 arrests per day. If this higher quota were to be in place, vastly more arrests of people without criminal histories will undoubtedly occur.
DHS has frequently cited targeting the apprehension of “those who pose the greatest threat to public safety and border security” as its primary focus. However, as experts have been predicting, the increase in arrests has come at the expense of apprehending more immigrants without criminal histories. The most recent increase in arrests have, indeed, been through methods that are more likely to target immigrants without criminal histories. With the recent passage of the reconciliation bill, and proposed increases to daily arrest quotas, this pattern will likely only grow worse.
This report was produced by East and Cox for the Immigration Research Initiative.
* Homeland Security Investigations (HSI) can also make both administrative and criminal arrests. Although HSI makes significantly fewer arrests than ERO. Specifically, HSI makes only about 4% of ICE’s total arrests.
- 1By law, ICE arrests do require an administrative warrant. There are only two exceptions in which a warrant is not required: “1. the alien, in the presence or view of the immigration officer, is entering or attempting to enter the United States unlawfully; or 2. the immigration officer has “reason to believe” that the alien is in the United States unlawfully and is likely to escape before a warrant can be obtained.”
- 2To be exact, we calculate the total number of arrests by AOR in the 156 days before the inauguration and compare that to the 156 days of information we have after the inauguration.