There are 50 million immigrants in the United States, making up 15 percent of the overall population. This includes all people who are living in the United States and were born in another country, irrespective of immigration status.
Around the country, the share of immigrants in the population varies from two percent in West Virginia to 28 percent in California. Below is a table to show where your state fits in.
This table also shows the number of non-citizens. Nationally, about half (51 percent) of all immigrants are naturalized citizens, and about half (49 percent) are non-citizens immigrants.
The three leading sources of data about immigrants who are unauthorized—Center for Migration Studies, Pew Research Center, and Migration Policy Institute—all estimate that of the 24 million immigrants who are not, or not yet, citizens, about half are unauthorized. It is important to note that among people who are unauthorized are a very significant number who the government has given some protection from deportation.
At the national level, the estimates of immigrants who are unauthorized range from 12.2 to 14.0 million. The table below shows the range of estimates state by state.
Note that we cannot simply divide the number of undocumented to get a precise undocumented share, since the methodologies for estimating the number of immigrants who are undocumented includes an adjustment for their undercount in the Census Bureau surveys.
IMMIGRANTS BY STATE AND POPULATION SHARE
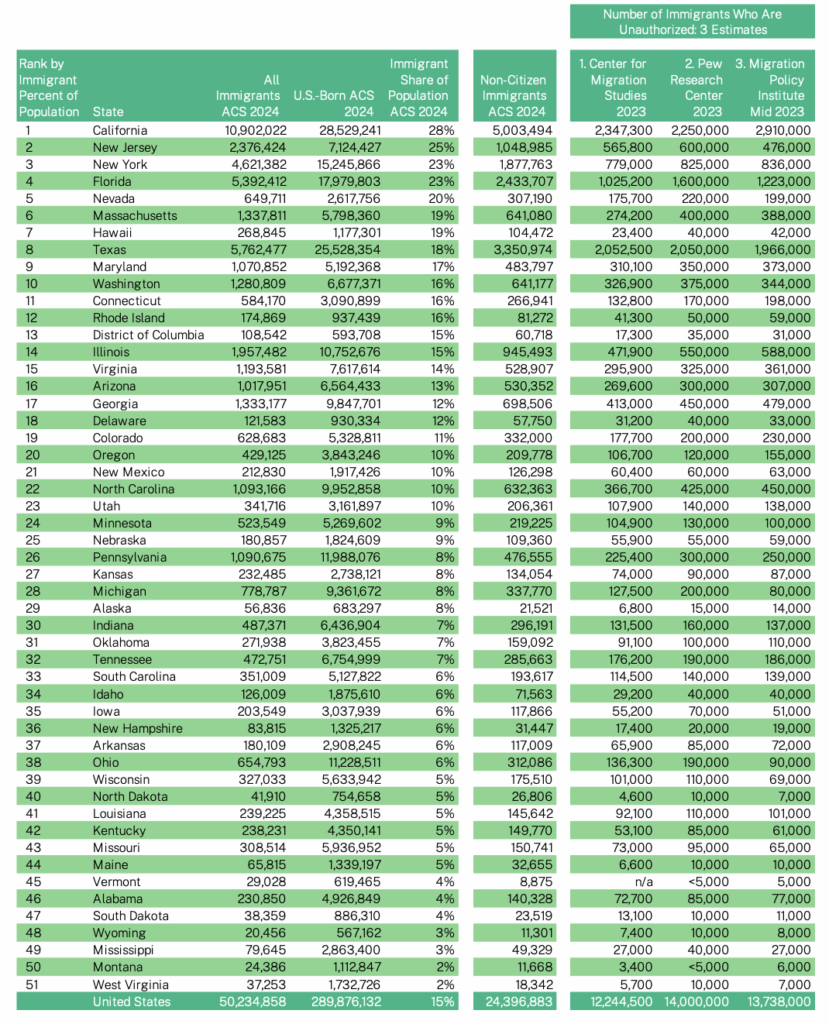
Sources: All immigrants, U.S.-born, total population, and non-citizen immigrants come from Immigration Research Initiative analysis of the 2024 American Community Survey. The three estimates of immigrants who are unauthorized come from the Center for Migration Studies, Pew Research Center, and Migration Policy Institute. CMS and Pew analyses are developed from the 2023 American Community Survey data. The MPI estimate is based on the pooled 2019-23 American Community Survey (ACS) and the 2023, 2022, and 2008 Survey of Income and Program Participation (SIPP), weighted to 2023 unauthorized immigrant population estimates provided by Jennifer Van Hook of The Pennsylvania State University.