The Entrepreneurial Spirit: A Profile of Business Owners Across the United States
The Contributions of Small Business Owners Who Are Immigrants, Women, African American and Native American

The Entrepreneurial Spirit
Entrepreneurship is an important part of the economic landscape across the United States. From Main Street businesses that help give a community its character to truck transportation or accounting businesses that keep the economy flowing, local business owners are part of what makes our communities vibrant.
Immigrants play a disproportionately important role as business owners. The 1.3 million immigrant business owners in the United States represent one in five (21 percent) business owners in the country.
Women, African Americans, and Native Americans are also key contributors to the local business landscape. Although these groups are less likely to be business owners in general, there are areas where their success is often overlooked that should be recognized and bolstered. There are 2.1 million women who are business owners, including both immigrants and U.S.-born women, making up 34 percent of all business owners. There are 321,000 African Americans—Black people born in the United States—who are business owners, making up five percent of all business owners, plus another 76,000, or one percent, of business owners who are Black immigrants. And there are 15,000 Native American or Alaska Native business owners.1People who identify as Native American or Alaska Natives in the American Community Survey make up 0.5 percent of the population, 0.4 percent of the labor force, and 0.2 percent of all business owners. Note that this is not a count of registered members of tribes, nor is it a count of people who live on Native American lands, it is a count of people who report being Native American in the Census Bureau’s American Community Survey. The data cited in this report is for people who report being Native American and were born in the United States This report documents areas where each of these groups has been successful and highlights areas where investment in developing entrepreneurship could fortify existing trends.
The business owners we highlight in this report contribute to the American economic landscape as entrepreneurs in every sector of the economy and in every metropolitan region of the country. Immigrant-owned businesses fill in gaps and expand the range of goods and services that add to the dynamism of the local economy and the vitality of the community. Businesses owned by women and underrepresented communities of color meet the critical needs of consumers who are often overlooked in the economic landscape. In this report, we have included the stories of several business owners from across the country who exemplify the entrepreneurial spirit, from a Bangladeshi car salesperson to an African American beauty salon owner to an East African business owner whose restaurant was nominated for the prestigious James Beard award.
Key findings from the analysis:
- More than 1 in 5 business owners are immigrants. Immigrants make up 21 percent of all business owners, higher than their share of the population (14 percent) or the labor force (17 percent).2The data in this report draw from an Immigration Research Initiative analysis of the 2023 American Community Survey 5-year data, except where otherwise noted. Business owners are defined as people who are self-employed and own an incorporated business.
-
Immigrants play a particularly big role on Main Street. Immigrants are especially likely to own “Main Street” businesses: grocery stores, restaurants, clothing stores, dry cleaners, and other small shops that give an area its character. Main Street businesses are part of the churn that constantly rejuvenates the local economy, and they can be especially important in areas that have seen boarded up storefronts and other signs of decline—in city neighborhoods, suburban commercial strips, and rural areas. Immigrants make up 27 percent of all Main Street business owners, including 34 percent of restaurant owners and 33 percent of grocery store/supermarket owners.
- Immigrant businessowners come from all over the world. The largest number of immigrant business owners in the U.S. are from Mexico. Among the top 10 countries for immigrant businesses, the highest propensity for business ownership is among people from Korea. And there are business owners in the U.S. from virtually every country in the world.
- There are some disparities in business ownership by race for both immigrants and U.S.-born people. Not all groups share equally in the opportunity of business ownership, and there are some key disparities along racial lines. While Black and Latine immigrants are less likely to own businesses than White and Asian immigrants, Black and Latine immigrants are more likely to be business owners than their non-immigrant counterparts.
- There are some key types of businesses where underrepresented groups have had significant success. From African American beauty salons and business consultants to Native American grocery stores, both on and off tribal lands, underrepresented groups are providing important services and meeting the needs of our communities in multiple sectors of the economy. These business owners are creating jobs, generating a tax base, and adding to the diversity and vibrancy of American life.
One Out of Five Business Owners is an Immigrant
Across the United States, immigrants own businesses from nail salons and construction operations to restaurants, grocery stores, doctors’ offices, and more. Gias Talukder embodies the diverse pathways that lead immigrants to business ownership. Originally from Bangladesh, Gias arrived in the United States in 1998. He worked in pharmacies for more than a decade until his brother joined him in Florida. In the process of helping his brother get a car, Gias stumbled into the used auto sales business.
“I was not a businessman,” Gias told ProsperUs Detroit in 2022. “For me, the business happened coincidentally.”
Now, Gias is the owner of Bengal Auto Sales in Hamtramck, Michigan in the Detroit metro area. He has also been eager to share his success. Gias says that since Bengal Auto Sales opened in 2013, he has given away upwards of 37 cars to people in need, free of charge.

Nationwide, immigrants make up 14 percent of the population, 17 percent of the labor force, and 21 percent of all business owners.3For the purposes of this report, we have defined business owners as any person in the U.S. labor force who identified as self-employed and said that they owned an incorporated business. We also limited our analysis to business owners who reported earned income greater than zero. Figure 1 shows how immigrants make up a large share of the labor force and an even bigger share of the business owning population. As the share of immigrants in the country grows, so too does the share of immigrant business owners. In 2000, for example, immigrants made up 12 percent of the labor force and 14 percent of all business owners. By 2010, those figures increased to 16 percent of the labor force and 18 percent of business owners. Today, immigrants make up 17 percent of the labor force and 21 percent of business owners.
In today’s political context, the United States is faced with the possibility that the number of immigrants would start decreasing rather than increasing. The economic consequences will be hard for the country. Shrinking the number of immigrants will predictably lead to a significant decrease in the number of business owners, with repercussions for the workers they employ, the communities they serve, and the local economies they help bolster.
IMMIGRANTS ARE MORE LIKELY TO BE BUSINESS OWNERS, ESPECIALLY MAIN STREET BUSINESS OWNERS
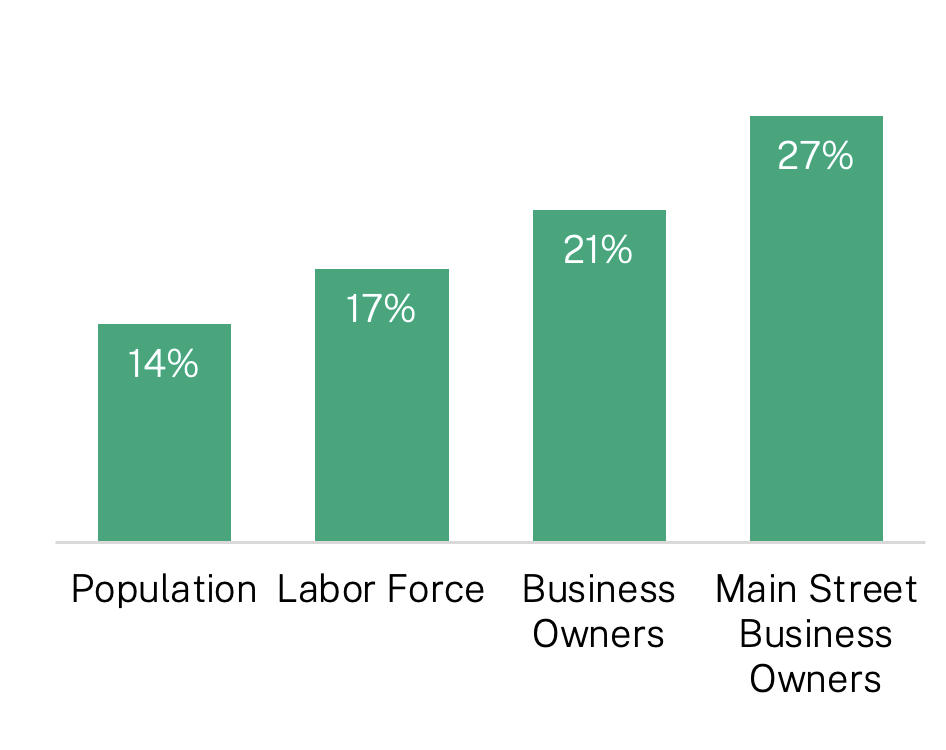
Fig. 1 IRI analysis of 2023 ACS 5-year data. Business owners are self-employed and own their own business. Five-year data is used to give detail on types of businesses with consistency throughout this report.
In the period from 2000 to 2023, the immigrant share of business owners increased in step with the growing immigrant share of the population. The immigrant share of population increased from 12 to 17 percent, and the immigrant share of business owners grew from 14 to 21 percent, so that today more than one in five business owners is an immigrant.
AS IMMIGRATION INCREASES, SO DOES IMMIGRANT BUSINESS OWNERSHIP
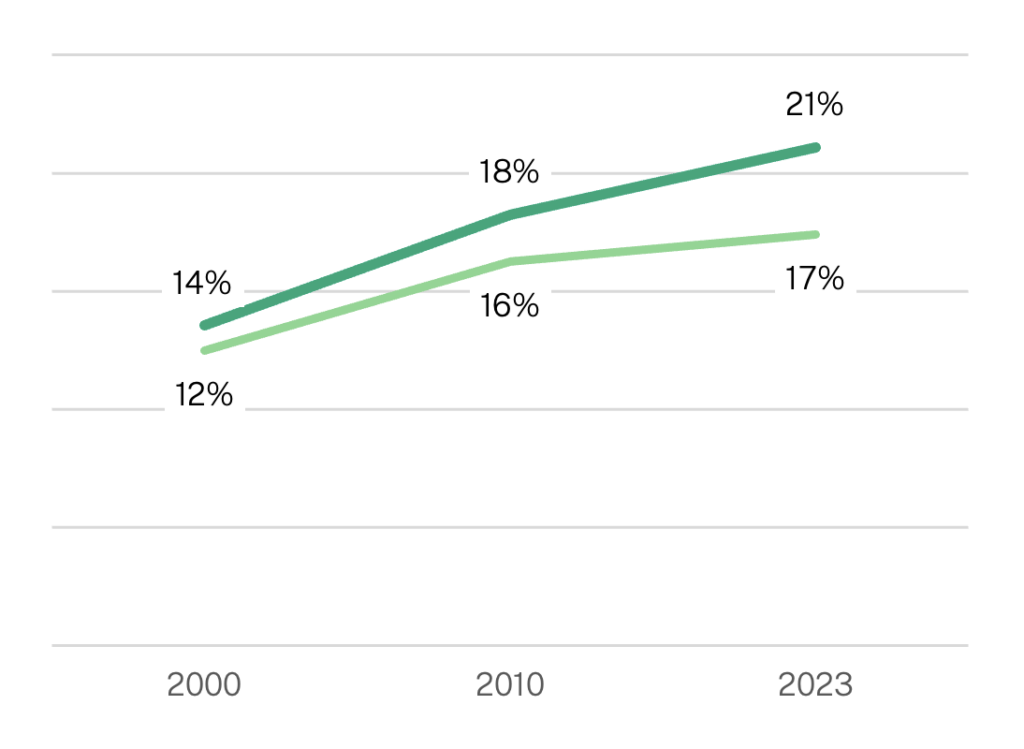
Fig. 2 IRI analysis of 2000 Census, 2010 ACS 1-year and 2023 ACS 5-year data.
Immigrant Businesses Are Economic Building Blocks
Owning a business entails risks, but those who succeed typically make a reasonably good living. The median annual earnings for immigrant business owners is $50,000. That is lower than the $60,000 median earnings for U.S.-born business owners, yet considerably higher than the $40,000 median wage for immigrant workers overall. Taken together, immigrants showed $116 billion in total earnings, more than double the inflation-adjusted $61 billion in earnings in 2000 (figure 3). In other words, in addition to their being growth in the number, and share, of immigrant-owned businesses, there also has been growth in earnings of these businesses.
A GROWING ECONOMIC IMPACT: TOTAL EARNINGS OF IMMIGRANT BUSINESS OWNERS
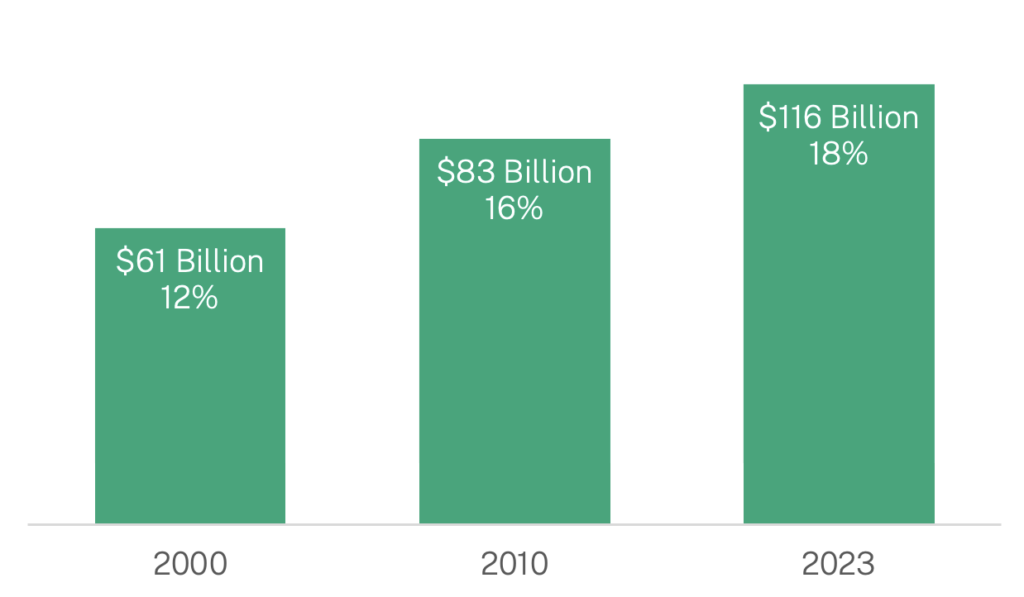
Fig.3 IRI analysis of 2000 Census, 2010 1-year ACS, and 2023 ACS 5-year data. Inflation-adjusted to 2023 dollars.
Immigrants’ Likelihood for Business Ownership is Remarkably High
One of the indicators we use to measure business entrepreneurship in this study is the propensity of business ownership. Propensity of business ownership is the likelihood of people in the labor force to be business owners—how entrepreneurial is a group, and how able are they to overcome barriers they face to be able to own a business? We calculated propensity to business ownership by taking the number of business owners and dividing it by the total number of people in the labor force. This approach does not account for individuals who own multiple businesses or who co-own businesses with other individuals—it is a count of people who are business owners, not a count of businesses.
The overall propensity for business ownership in the United States is 3.7 percent. That is, for every 1,000 workers—both immigrants and U.S.-born—in the labor force, 37 own an incorporated business. As shown in Figure 4 below, immigrants have a higher propensity for business ownership than U.S.-born workers. While 35 of every 1,000 U.S.-born people in the labor force are business owners, immigrants have a propensity of business ownership of 4.4 percent, or 44 business owners for every 1,000 immigrants in the labor force.
IMMIGRANTS HAVE A GREATER PROPENSITY TO BUSINESS OWNERSHIP
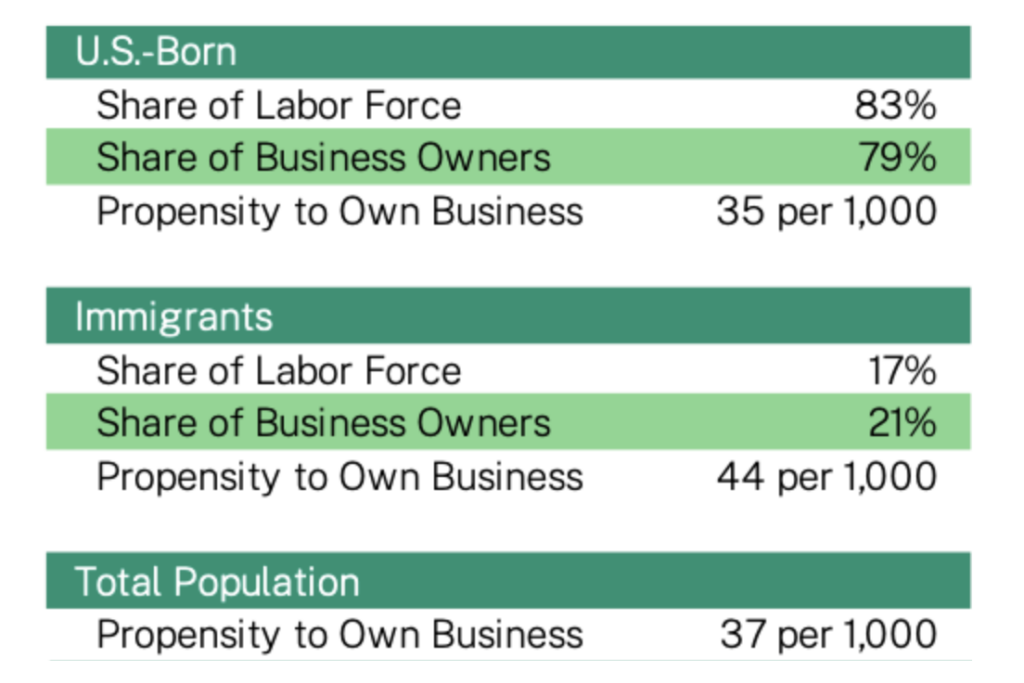
Fig. 4 IRI analysis 2023 ACS 5-year data. Propensity to own a business is calculated as business owners per 1,000 people in the labor force.
The story of immigrant business ownership also includes newly arriving immigrants. Even the most recent immigrants have a significant propensity for business ownership, and immigrants grow increasingly likely to own businesses the longer they spend in the United States. For every 1,000 immigrant workers who have been in the U.S. for less than five years, 24 are business owners. That figure rises to 35 per 1,000 for those who have been here between six and ten years, 37 for those who have been here between 11 and 15 years, 43 for those who have been here 16 to 20 years, and 54 for those here 21 years or more.
THE LONGER IMMIGRANTS ARE IN THE U.S. THE HIGHER THEIR PROPENSITY TO BUSINESS OWNERSHIP
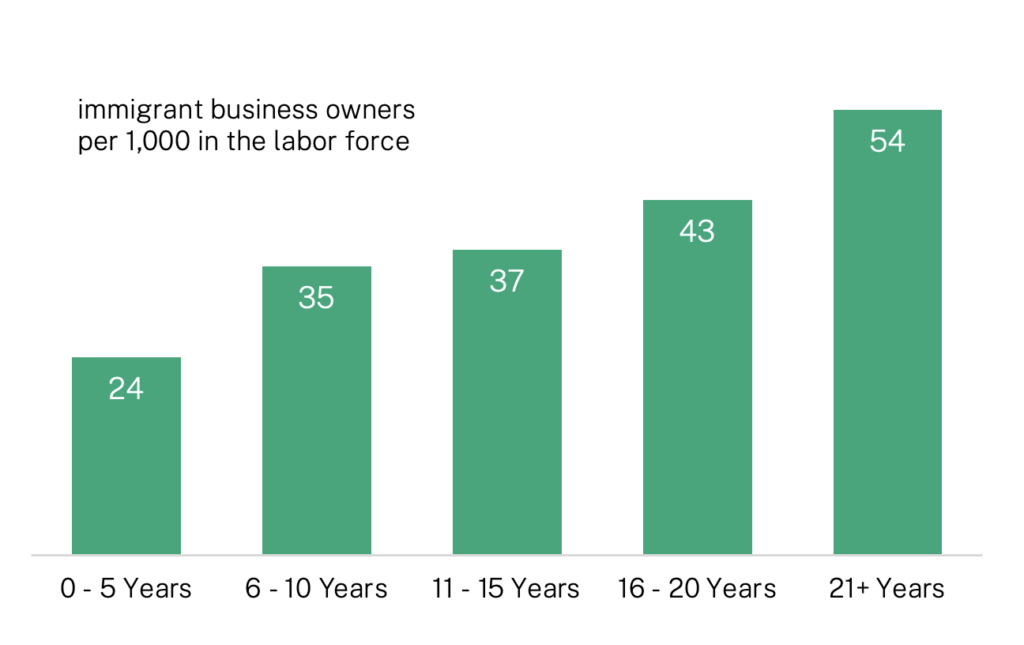
Fig. 5 IRI analysis 2023 ACS 5-year data.
There are both “good” and “bad” reasons for the higher levels of immigrant entrepreneurship.
On the positive side, immigrants typically share some key characteristics commonly associated with entrepreneurship such as taking a risk and starting something new. As Edward Roberts, the David Sarnoff Professor of Management of Technology at the Sloan School of Management at the Massachusetts Institute of Technology (MIT) and the founder and chair of the MIT Entrepreneurship Center, has pointed out that “[t]o immigrate is an entrepreneurial act.”4Richard T. Herman and Robert L. Smith, “Immigrant, Inc.” (2009)
Immigrants also often bring with them a familiarity with products and services that are common in other countries and may be transferrable to the United States. They often broaden the scope and diversity of retail products and experiences or offer products in a new way, be it a new ethnic restaurant, grocery store with new food products, or services such as acupuncture.
On the negative side, immigrants may turn to business ownership after being excluded from certain job opportunities or more traditional employment. An engineer may be operating a food cart, or an accountant may be working on their own rather than being employed in a company with better wages and benefits. These may be an economic step below the immigrants’ full potential. Then again, even businesses that start as stop-gap measures or second choices can grow to be very successful.
Potential entrepreneurs benefit greatly from support in thinking through their business plans and support for their growth. The Central Valley Immigrant Integration Collaborative in California’s Central Valley is an example of an organization that often helps people in the immigrant communities they serve to get started as business owners. Since 2020, CVIIC has been invested in recruiting and training entrepreneurial immigrants who aspire to business ownership, especially from working-class, Latine backgrounds.
The group has a program designed to help train entrepreneurial immigrants as business owners called Inmigrantes Emprendedores Regional Program. In addition to helping program participants learn the essential skills associated with owning a business, CVIIC also funds grants, which have been administered to hundreds of new entrepreneurs since its inception in 2021. The grants help budding entrepreneurs get their businesses off the ground with vital funding. Among the many graduates of the training program, a recent success story is Minerva Flores, who finished in early 2026 and has since opened a massage therapy clinic in Sanger, California. Milly Holistic Therapy offers professional massages and holistic therapeutic treatments to Minerva’s clients. Minerva was also a recipient of one of CVIIC’s grants, receiving $1,000 to help get her started.

Immigrants Own a Wide Range of Businesses
Immigrants own businesses in virtually every sector of the economy. There are, however, some types of businesses where immigrants make up a disproportionate share of the total. Immigrants make up 60 percent of all taxi and limousine business owners, for example, as well as 35 percent of all trucking business owners, and 24 percent of all owners of doctors’ offices.
The simple truth is that most Americans are likely already patronizing an immigrant-owned business, often on a daily basis, whether they know it or not. Even in the most unexpected of places, immigrants are working within local economies to provide services and expand the cultural milieu of virtually every location in America.
In Anchorage, Alaska, for example, an Egyptian immigrant named Rasha has brought the flavors of her home to her friends and neighbors for years. Known around the city for her baklava and other sweet treats, Rasha recently completed all the requirements to be able to cater parties and events around Anchorage. One of her first major gigs was serving food for the Anchorage Assembly, the city’s legislative body. Rasha said she and her husband Sayed leapt at the opportunity to feed their local elected officials. Now, Rasha is known for bringing Egyptian treats to farmer’s markets and caters private events with the eventual goal of opening her own brick-and-mortar restaurant.

The top ten types of businesses for immigrant entrepreneurs, in terms of the number of incorporated business owners, are construction (194,000 business owners), restaurants (94,000), truck transportation (64,000), real estate brokers (45,000), consultants (41,000), computer systems design (37,000), building services (35,000), physicians’ offices (32,000), taxi and limousine services (28,000) and landscaping services (27,000).
Figure 6 shows how important the role of immigrants is in each type of business: immigrants make up 60 percent of all of the business owners providing taxi and limousine services, 35 percent of those with truck transportation businesses, and 34 percent of those with restaurants, for example. Again, in each case, these are people who are self-employed and own their own incorporated business. Self-employed taxi drivers, for example, are not included unless they also report owning an incorporated business.
TYPES OF BUSINESSES OWNED BY IMMIGRANTS
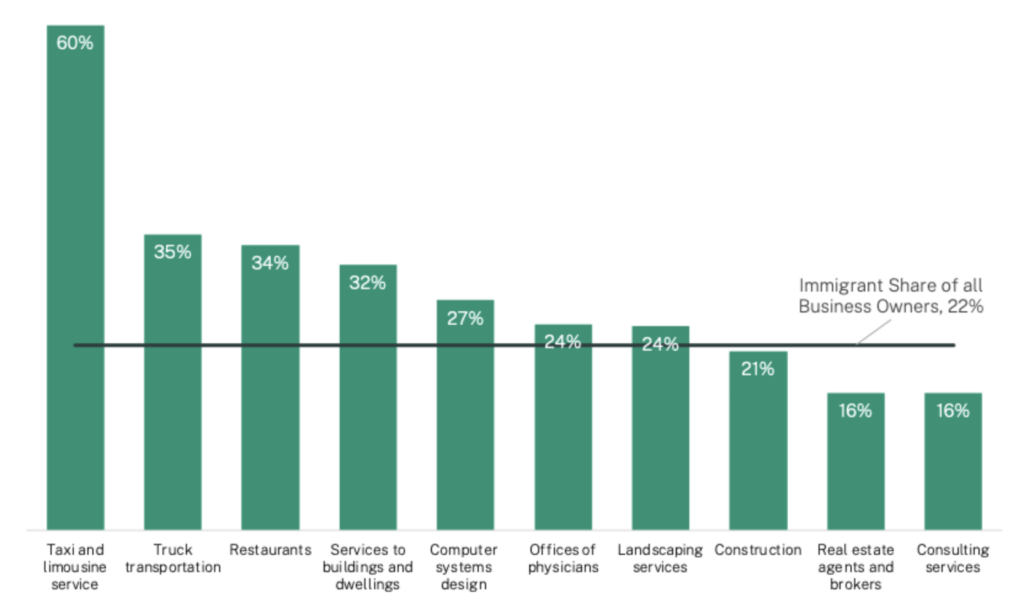
Fig. 6 Shown here are the 10 types of businesses with the largest number of immigrant owners. The percentages show the share of immigrant business owners among all business owners in that type of business. IRI analysis of 2023 ACS 5-year data.
These are also areas where we can expect significant disruptions in the current federal push to de-document people with various forms of legal status from Temporary Protected Status to asylum seekers; to restrict small business loans so that immigrants, even those with legal permanent residence or work permits who previously qualified can no longer get the loans; and to force new English-language proficiency requirements on trucking businesses.5As of March 1, 2026 the Small Business Administration has cut off immigrants who previously qualified for its primary loan program if they hold green cards or other non-citizen status. An executive order from 2025 requiring English proficiency tests for truck drivers resulted in 9,500 commercial drivers to be taken off the roads in December 2025, https://www.cnbc.com/2025/12/10/trump-transportation-duffy-truckers-fired-english.html
Immigrant Business Owners Come from Around the World
In our analysis, it became clear that immigrant business owners come from all over the world. Figure 7 shows the top countries of birth for foreign-born business owners. The country of origin for the highest number of business owners is Mexico — if this comes as a surprise, it shouldn’t since Mexico also has the largest number of immigrants in the U.S.
More surprising, perhaps, is that immigrants from some countries have remarkably high propensity for business ownership. That is, some immigrants are far more likely to own businesses, indicating that part of the immigration story for people from these countries includes using entrepreneurship to build a better life for themselves and their families.
TOP 10 COUNTRIES OF BIRTH FOR BUSINESS OWNERS
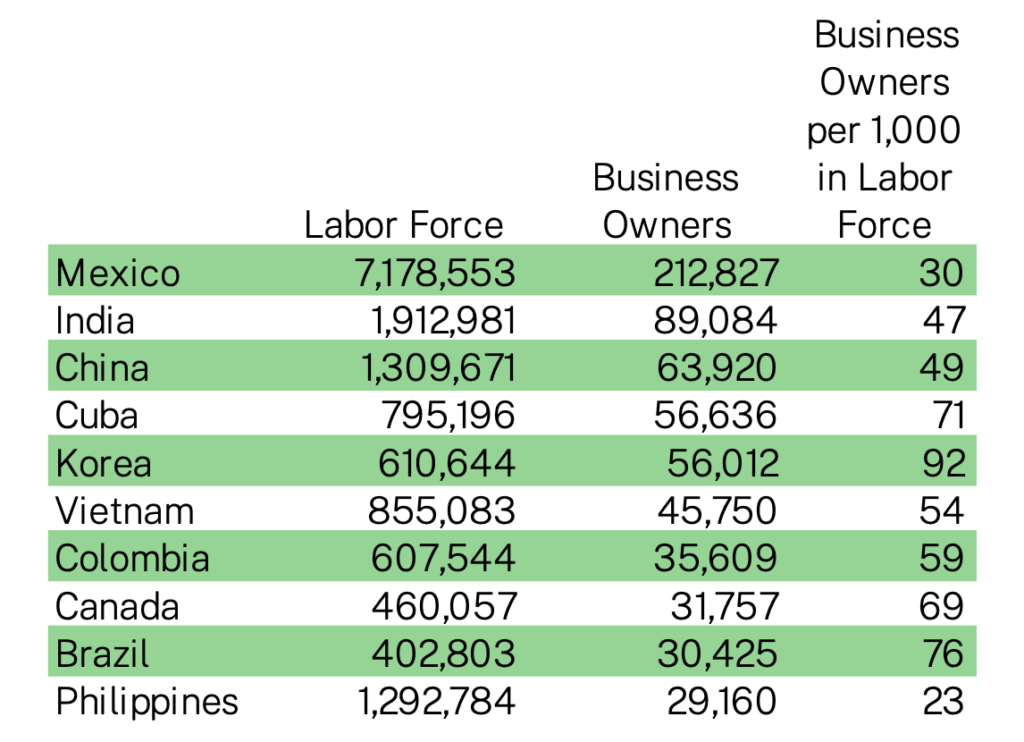
Fig. 7 IRI analysis of 2023 ACS 5-year data. Counts are rounded to nearest thousand.
Mexican immigrants have a propensity to business ownership of 30 per 1,000 in the labor force, somewhat below the overall average of 37 and the U.S.-born average of 35. By contrast, Korean Americans have a remarkably high propensity for business ownership of 92 per 1,000. Other countries of origin with high propensities for business ownership include Brazilians at 76 per 1,000, Cubans at 71 per 1,000, and Colombians at 59 per 1,000. Indians, Chinese immigrants, and Vietnamese immigrants all have a propensity of business ownership of about 50 per 1,000. These are the top ten countries of birth for immigrant business owners. The propensity to business ownership is even higher among some groups that are not in this top ten. For example: for every 1,000 immigrant workers from Iran there are 95 business owners, and 107 from Greece. Among the top 50 countries of birth for immigrants, people who report being born in Israel/Palestine, the grouping as it is reported in the Census data, have the highest propensity for business ownership, 140 per 1,000 workers.
Of the 213,000 Mexican immigrants who own businesses in the United States, 62,000 own construction businesses, making it by far the most common type of business owned by Mexicans. Again, these are people who are self-employed and own their own incorporated business. The next most common type of business was in restaurants, where 17,000 Mexican immigrants own businesses, then landscaping services with 15,000 business owners, trucking services with 12,000 business owners, and building services with 11,000 business owners.
For immigrants from India, on the other hand, the most common type of business owned was in computer system and design services, where there are 13,000 Indian immigrant business owners. Another 7,000 Indian Americans also own doctors’ offices, 5,000 own management and consulting firms, and another 5,000 own restaurants. Many Indian Americans also own gas stations (4,000) and hotels (2,000).
Main Street Businesses Sustain Local Economies
While immigrant workers are more likely to be business owners than U.S.-born workers, our research revealed that immigrants are far more likely to own “Main Street” businesses. Immigrants make up 21 percent of all business owners and 27 percent of all Main Street business owners in the United States.6This analysis of Main Street businesses builds on the report Bringing Vitality to Main Street: How Immigrant Small Businesses Help Local Economies Grow, by David Dyssegaard Kallick, published by Fiscal Policy Institute and Americas Society/Council of the Americas, January 2015.
Main Street businesses are defined here as those storefront institutions we rely on every day like grocery stores, nail salons, gas stations, and restaurants. Main Street businesses are a big part of what gives an area its character and help keep our downtown areas, commercial retail strips, neighborhoods and small-town centers active and thriving.
A good example of how immigrants who own Main Street businesses keep communities thriving is Mamba Hamissi, who—along with his wife Nadia—owns Baobab Fare, a popular restaurant in Detroit’s’ New Center neighborhood. Originally from Burundi, Mamba and Nadia came to the United States seeking asylum after Nadia—a women’s rights activist—was forced to flee the country due to persecution. Mamba has said that it’s important for him to give back to his new home. On the restaurant’s website, Mamba calls Detroit “a place that welcomed us with open arms and because of that, we have the responsibility to encourage enrichment of the city.”

In addition to Baobab Fare, Mamba and Nadia own Soko, an East African market that seeks to combat the harmful narratives about Africa in the United States, as well as Waka, a 100% halal food truck that makes the food at Baobab Fare more convenient and accessible to Detroiters.
Figure 8 shows the types of Main Street businesses as well as the immigrant share of all business owners for each kind of business. Immigrant business owners account for 50 percent of all dry cleaners, 47 percent of all gas stations owners, 45 percent of all convenience store owners, 43 percent of all nail salon owners, 34 percent of hotel owners, 34 percent of restaurant owners, and 33 percent of all grocery store and supermarket owners.
TYPES OF MAIN STREET BUSINESSES OWNED BY IMMIGRANTS
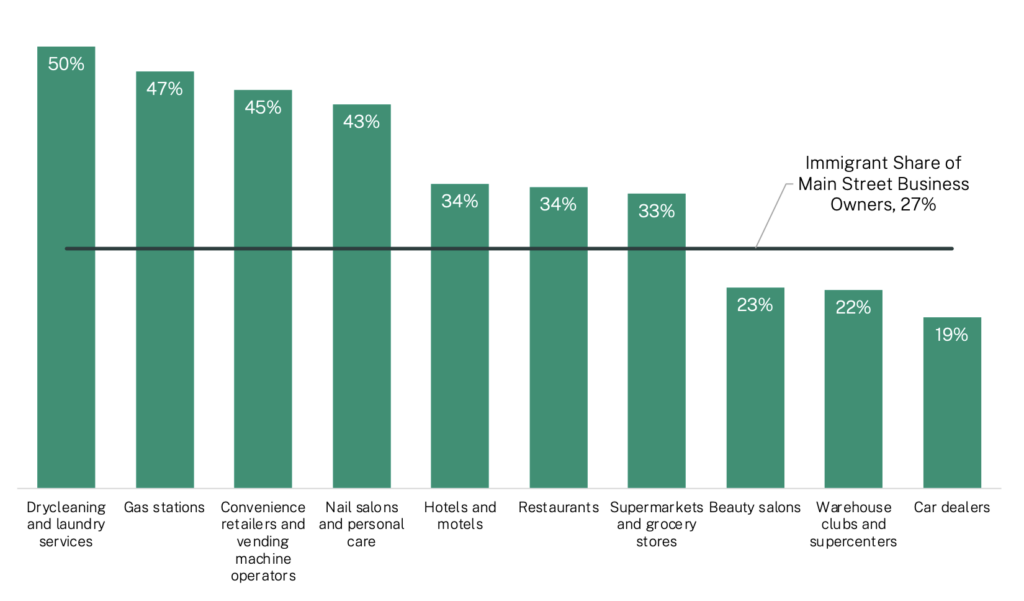
Fig. 8 Shown here are the 10 types of Main Street businesses with the largest number of immigrant owners. The percentages show the share of immigrant business owners among all business owners in that type of business. IRI analysis of 2023 ACS 5-year data. See text for definition of Main Street businesses.
Disparities in Business Ownership by Race and Gender
The overall propensity for business ownership in the U.S. labor force is 37 business owners per 1,000 people in the labor force, as noted above. But the numbers vary significantly when broken down by race and gender. Women, for example, are far less likely in general to own businesses than men. While women make up about half (47 percent) of the U.S. labor force, they make up just 34 percent of all business owners. Immigrant women are more proportionately represented as business owners, making up eight percent of the labor force, and seven percent of all business owners. Figure 9 shows how women overall, as well as immigrant women, participate in business ownership.
WOMEN AND BUSINESS OWNERSHIP
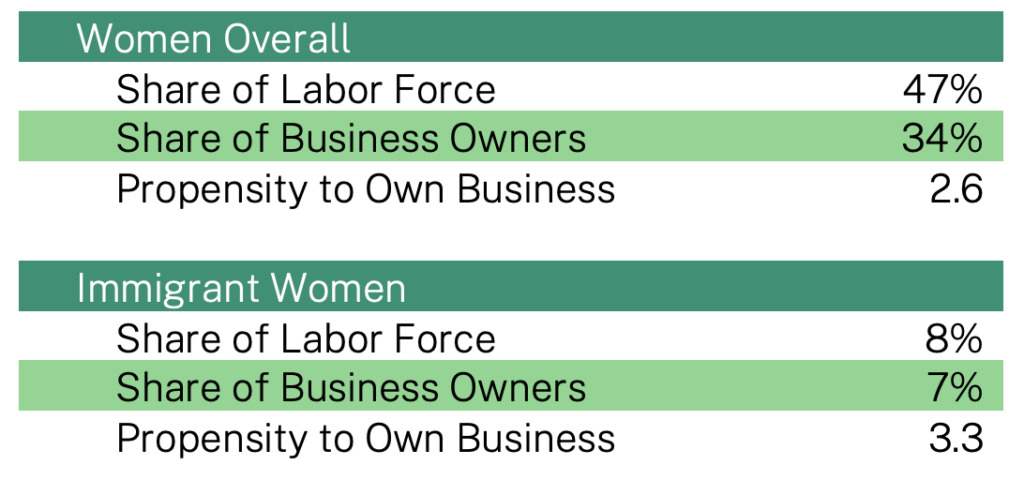
Fig. 9 IRI analysis of 2023 ACS 5-year data.
Despite the overall disparities in business ownership for women, there are some types of businesses where women are very strongly represented. Eighty-five percent of beauty salon owners are women, for example, as are 62 percent of outpatient care center owners, 47 percent of accounting and booking keeping firm owners, and 46 percent of owners of real estate brokerages and leasing agencies. Women also account for 43 percent of restaurant owners in the United States.
TOP BUSINESSES OWNED BY ENTREPRENEURS WHO ARE WOMEN (IMMIGRANTS AND U,S.-BORN WOMEN COMBINED)
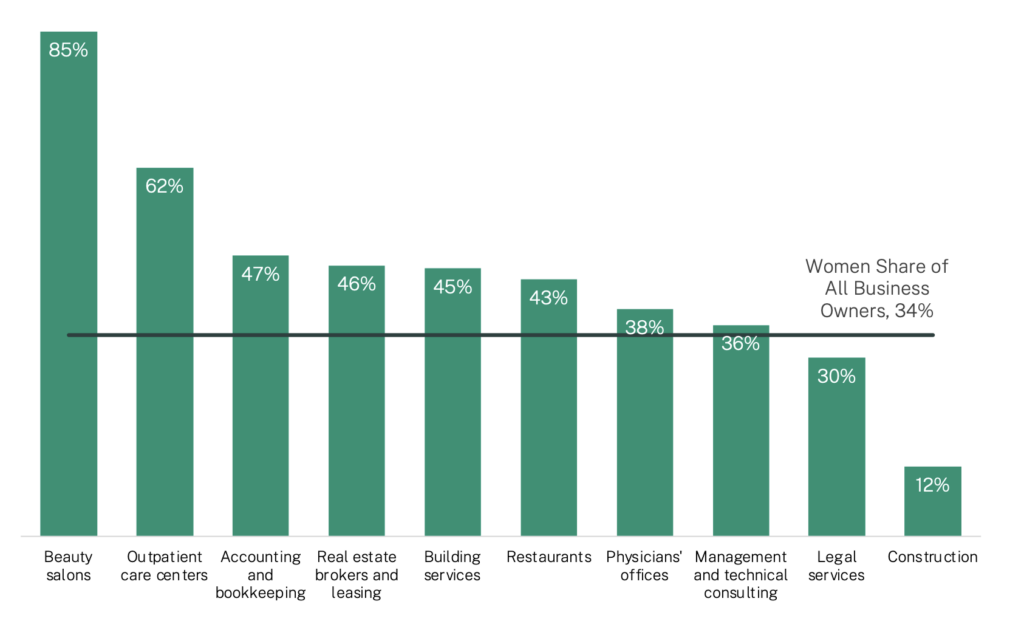
Fig. 10 Shown here are the 10 types of businesses with the largest number of business owners who are women, combining immigrants and U.S.-born women. The percentages show the share of women business owners among all business owners in that type of business. IRI analysis of 2023 ACS 5-year data. Gender choices in Census Bureau questions allow people to identify as male or female, but no other gender.
TOP BUSINESSES OWNED BY IMMIGRANT WOMEN ENTREPRENEURS
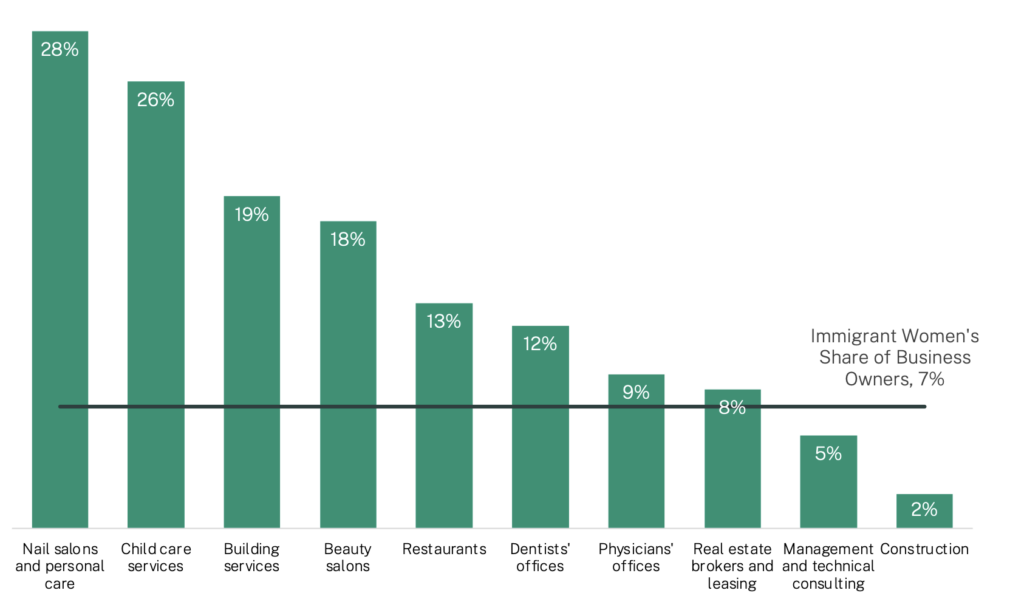
Fig. 11 Shown here are the 10 types of businesses with the largest number of business owners who are women, combining immigrants and U.S.-born women. The percentages show the share of women business owners among all business owners in that type of business. IRI analysis of 2023 ACS 5-year data.
Immigrant women also own disproportionately high shares of certain businesses, like 28 percent of all nail salons, 26 percent of childcare services, 19 percent of building services businesses, 18 percent of beauty salons, and 13 percent of all restaurants.
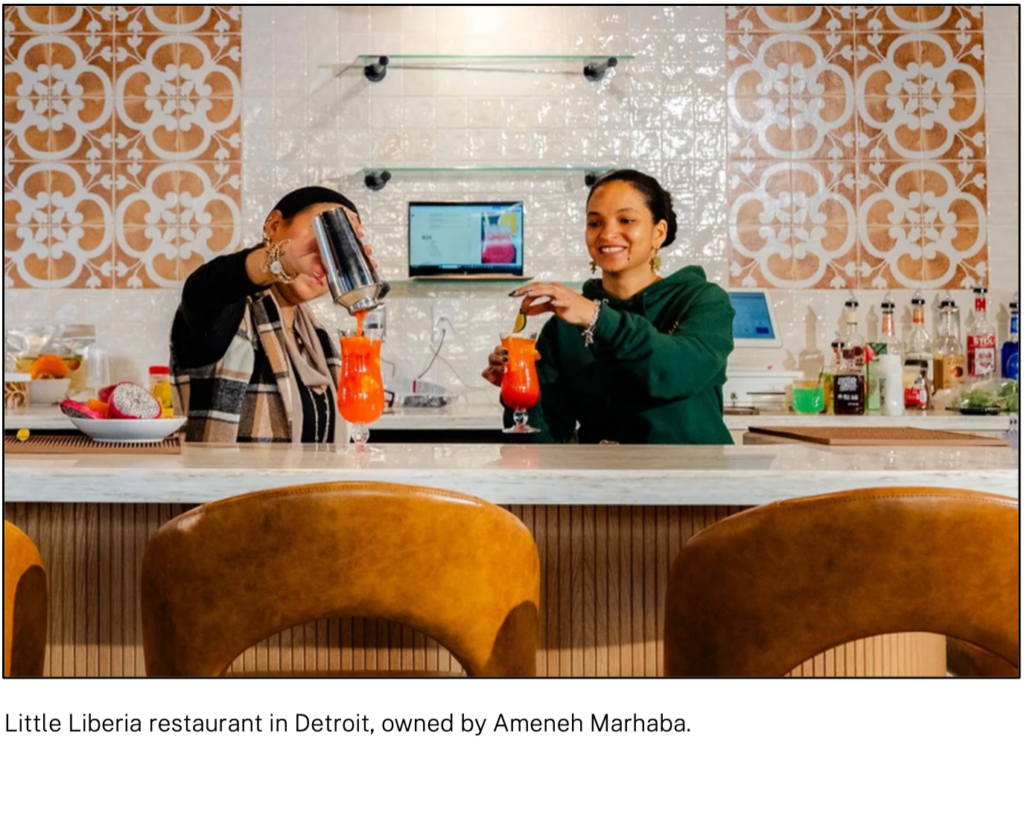
One example of a woman running a successful, and growing business is Ameneh Marhaba. Ameneh is the owner of Little Liberia, a restaurant in Detroit that first started as a pop-up experience. For years, Ameneh would borrow space from other restaurants to host events designed to expose customers to the diverse tastes of Liberian food. After searching and scraping together the money she needed, Ameneh is now preparing to open her own permanent brick-and-mortar space for Little Liberia. Ameneh said she hopes her restaurant can be a place for people to sit, enjoy delicious food, and perhaps even learn a little about Liberia.
Black Business Owners Face Challenges and Overcome Hurdles
As shown in Figure 12 below, U.S.-born Black workers have a significantly lower propensity for owning a business than other groups. For every 1,000 U.S.-born Black workers there are 19 Black business owners. U.S.-born white workers, by contrast, have a propensity for business ownership of 41 per 1,000, lower than the rate of 44 per 1,000 for immigrant workers but higher than the rate of 30 per 1,000 for U.S.-born Asian Americans and Pacific Islanders, 23 per 1,000 for U.S.-born Latine workers, and 21 per 1,000 for American Indians and Alaska Natives.
Among immigrants, too, race makes a difference. Among Black immigrants, the propensity to business ownership is 27 per 1,000, compared to 71 per 1,000 for white immigrants, 49 per 1,000 for Asian and Pacific Islander immigrants, and 36 per 1,000 for Latine immigrants.
In all cases, immigrants still had a higher likelihood of owning a business than their U.S.-born counterparts of the same race. Still, it remains clear that not everyone shares equally in the opportunity of owning a business in the U.S. economy.
To look at the numbers a different way, U.S.-born Black workers make up 10 percent of the American labor force, but only 5 percent of all business owners. Meanwhile, U.S.-born white workers make up 56 percent of the labor force, and 63 percent of all business owners. U.S.-born Latine individuals are also disproportionately under-represented as entrepreneurs, making up 11 percent of the labor force but just seven percent of incorporated business owners.
BLACK BUSINESS OWNERSHIP
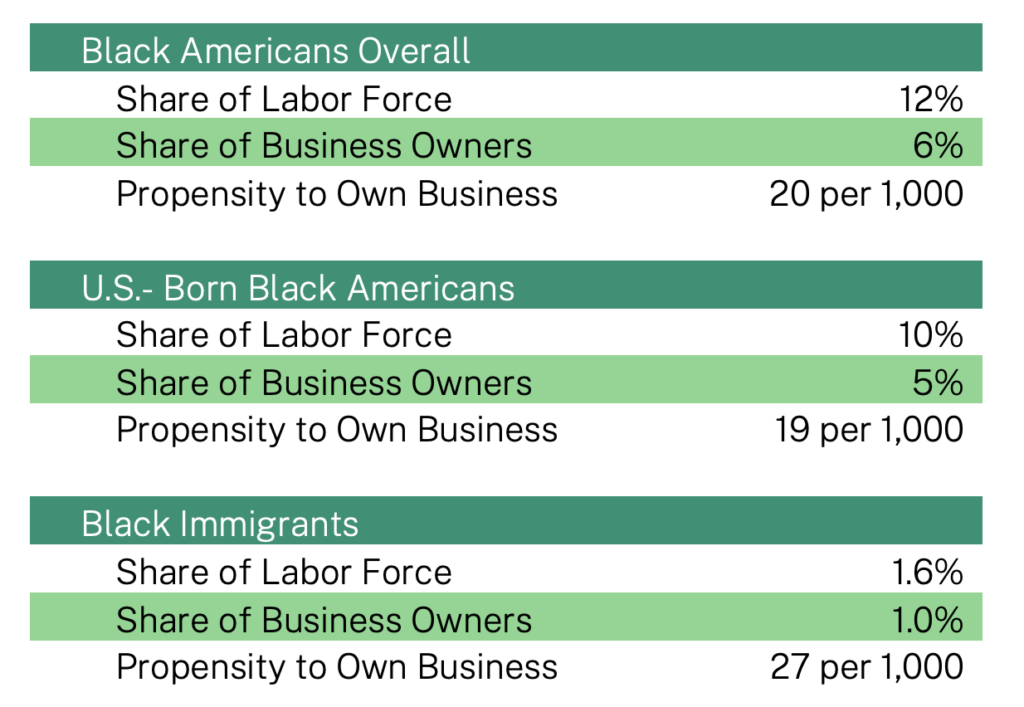
Fig. 12 IRI analysis of 2023 ACS 5-year data.
Among U.S.-born Black people, the most common type of business owned is in truck transportation: 25,000 U.S.-born Black business owners have a business in that industry. Behind trucking, there are 24,000 U.S.-born Black construction business owners. There are also 14,000 restaurant owners and 13,000 management and consulting firms.
These areas of strength of Black business ownership are worth noting and supporting. If U.S.-born Black entrepreneurs have shown the ability to succeed running businesses as truck drivers, beauty salon owners, or in building services despite conditions that are generally challenging for Black business owners, small business support programs, urban planners and the infrastructure of economic development might give more support to these types of businesses. At the same time, we should think critically about why it is not going as well for Black entrepreneurs in other types of businesses—including where structural factors and systemic racism block opportunities. The impacts would be direct, in seeing more businesses form and grow, and also indirect as the agencies might learn more about how to support Black-owned businesses in general and develop a larger pool of business owners who can support these efforts.

Consider, for example, Nicole Grant, an African American woman running her own beauty salon in Detroit called MG Studio Salon. Nicole told ProsperUs in Detroit that she grew up wanting to be a hair stylist. She opened MG Studio in 2008, offering a unique personalized experience to her customers. In 2023, she expanded to open MG Studio Salon, which also sells 21 different hair products under her brand. She hopes to keep growing her business and even open a second location one day.
TOP BUSINESSES ONED BY BLACK ENTREPRENEURS (IMMIGRANTS AND AFRICAN AMERICANS COMBINED)
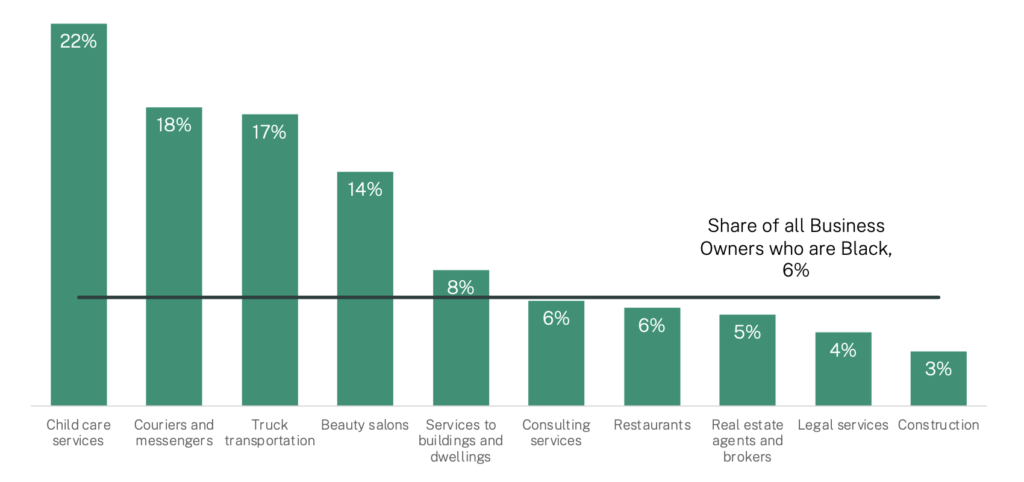
Fig. 13 Shown here are the 10 types of businesses with the largest number of business owners who are Black or African American, combining immigrants and U.S.-born business owners. IRI analysis of 2023 ACS 5-year data
LATINE BUSINESS OWNERSHIP
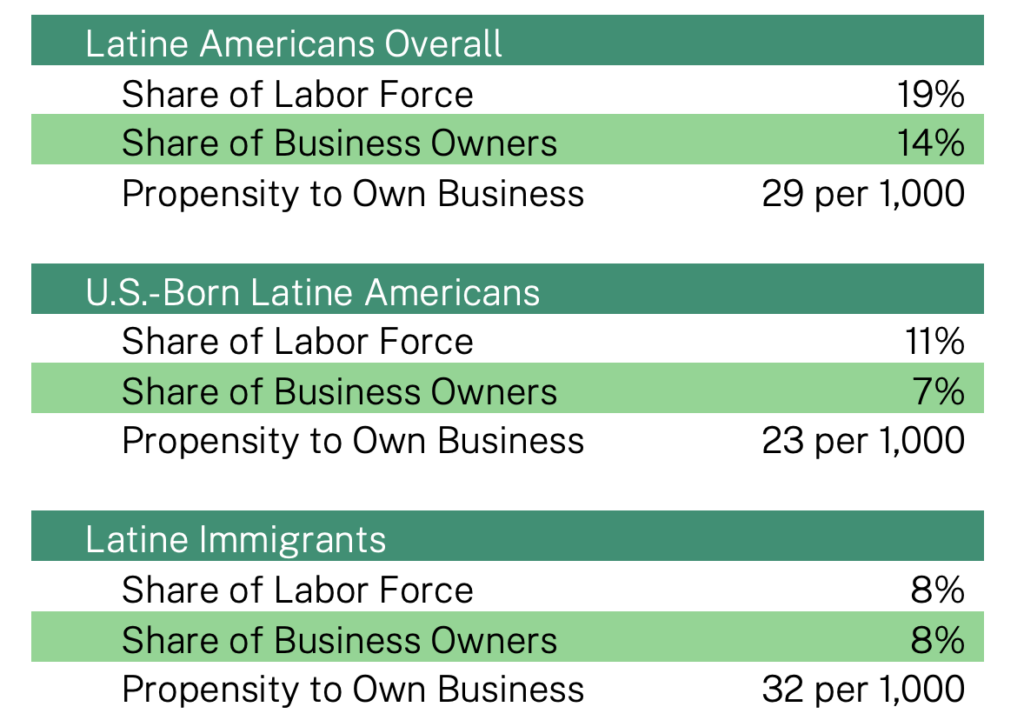
Fig. 14 IRI analysis 2023 ACS 5-year data.
Latine Business Ownership
There are 900,000 Latine business owners in the United States. A little more than half (54 percent) are immigrants, and a little less than half (46 percent) U.S.-born. Earlier section included information about immigrants from Mexico, Cuba, Colombia and Brazil who are Latine business owners around the country.
Latine business owners who were born in the United States include people from Puerto Rico or other U.S. territories, who are U.S. citizens by birth, and Latine people who are second or third generation immigrants, or who have an ancestry that stretches further back. Among U.S.-born Latine business owners, the top category of business ownership is in construction businesses, with 61,000 business owners in that industry. The next most common business for U.S.-born Latine workers is in restaurants, where 26,000 U.S.-born Latine people own businesses, followed 19,000 real estate agency owners and 15,000 trucking business owners.
In thinking about how to support economic growth, economists often note that a good place to start is with the strengths already shown by saying “it’s easier to pull on a string than to push on a string.” The same is true here: where U.S.-born Latine business owners show strength that is a good place to start in supporting further growth—again, as a way to expand the number of business owners directly, as a way to learn how best to support Latine businesses, and as a way to expand the pool of Latine entrepreneurs who can advocate for growth in the community.
TOP BUSINESSES OWNED BY U.S.-BORN LATINE ENTREPRENEURS

Fig. 15 Shown here are the 10 types of businesses with the largest number of business owners who are Latine, combining immigrants and U.S.-born business owners. IRI analysis of 2023 ACS 5-year data
Native American Business Ownership
The most common business owned by American Indians and Alaska Natives was construction with 3,000 business owners. Other areas where American Indians and Alaska Natives own businesses include restaurants, truck transportation, and consulting services. Sample size it not large enough, however, to report specific numbers of business owners.
NATIVE AMERICAN BUSINESS OWNERSHIP
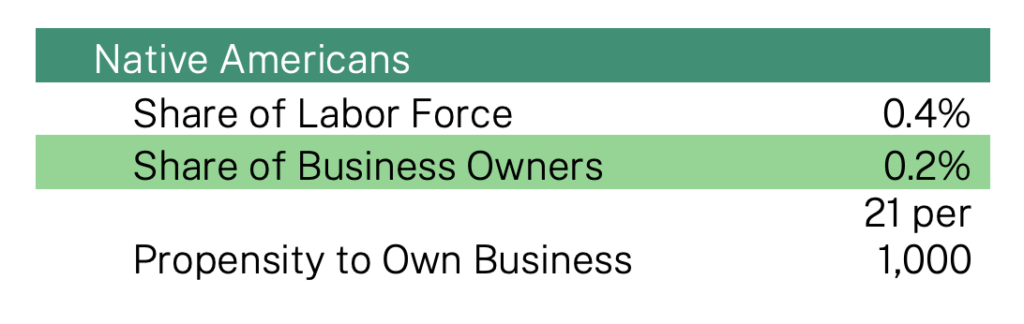
Fig. 16 IRI analysis of 2023 ACS 5-year data. Native Americans includes the Census category “American Indians and Alaskan Natives.” In this table we include only people born in the United States.
Conclusion
The current climate of political hostility to immigrants and to people of color, and a longstanding underappreciation of the economic role women play in our economy, makes it important to draw out the vibrant ways all these groups add to the American economy and society as community members, as workers, and as business owners too. All of these businesses help sustain and revitalize neighborhoods and communities across the nation, creating jobs and generating economic activity and making this country a dynamic place to live and thrive.
About Us
Immigration Research Initiative
Immigration Research Initiative is a nonprofit, nonpartisan think tank on immigrant integration, looking at issues of economic, social, and cultural inclusion of immigrants in the United States. IRI is attentive to how immigrants fare in the United States and to how the receiving communities fare as they change, with particular attention to the implications for race, gender, and income equity. immresearch.org.
E Pluribus
E Pluribus is a national initiative led by Global Detroit committed to broadening and deepening the state and local immigrant-inclusive economic development field. E Pluribus provides specialized technical assistance, national programs, advocacy, and peer learning networks. Its work draws upon Global Detroit’s success over the past 15 years in establishing networks, chronicling best practices, and advancing the growing movement of immigrant-inclusive economic development. E Pluribus is sparking a movement that promotes the growth, revitalization, and sustained prosperity of communities across America. It recognizes that economic development efforts prioritizing immigrant inclusion are profoundly a local endeavor. globaldetroitmi.org/e-pluribus
Build from Within Alliance
The Build from Within Alliance (BfWA) is a national network of community and economic development organizations supporting local entrepreneurship in some of America’s lowest-income urban, rural, and Native communities. BfWA has 22 members located in 17 cities throughout the country, who share the belief that successful, resident-owned businesses are critical to revitalizing and breaking cycles of poverty in neighborhoods impacted by historic disinvestment. bfwalliance.org
- 1People who identify as Native American or Alaska Natives in the American Community Survey make up 0.5 percent of the population, 0.4 percent of the labor force, and 0.2 percent of all business owners. Note that this is not a count of registered members of tribes, nor is it a count of people who live on Native American lands, it is a count of people who report being Native American in the Census Bureau’s American Community Survey. The data cited in this report is for people who report being Native American and were born in the United States
- 2The data in this report draw from an Immigration Research Initiative analysis of the 2023 American Community Survey 5-year data, except where otherwise noted. Business owners are defined as people who are self-employed and own an incorporated business.
- 3For the purposes of this report, we have defined business owners as any person in the U.S. labor force who identified as self-employed and said that they owned an incorporated business. We also limited our analysis to business owners who reported earned income greater than zero.
- 4Richard T. Herman and Robert L. Smith, “Immigrant, Inc.” (2009)
- 5As of March 1, 2026 the Small Business Administration has cut off immigrants who previously qualified for its primary loan program if they hold green cards or other non-citizen status. An executive order from 2025 requiring English proficiency tests for truck drivers resulted in 9,500 commercial drivers to be taken off the roads in December 2025, https://www.cnbc.com/2025/12/10/trump-transportation-duffy-truckers-fired-english.html
- 6This analysis of Main Street businesses builds on the report Bringing Vitality to Main Street: How Immigrant Small Businesses Help Local Economies Grow, by David Dyssegaard Kallick, published by Fiscal Policy Institute and Americas Society/Council of the Americas, January 2015.